// 格式化文字,超过长度添加省略号
        chart.axis('city', {


            label: {


             formatter: (text) => {


              // 字符太长添加省略号
             return text.length > 5 ? `${

      text.slice(0, 5)}...` : text;
             }
            }
        })
完整 demo:
<!DOCTYPE html>
<html lang="en">
<head>
<meta charset="UTF-8">
<meta name="viewport" content="width=device-width, initial-scale=1.0">
<meta http-equiv="X-UA-Compatible" content="ie=edge">
<title>G2</title>
</head>
<!-- 引入G2在线资源 -->
<script src="https://gw.alipayobjects.com/os/lib/antv/g2/3.4.10/dist/g2.min.js"></script>
<body>
<div id="c1"></div>
<script>
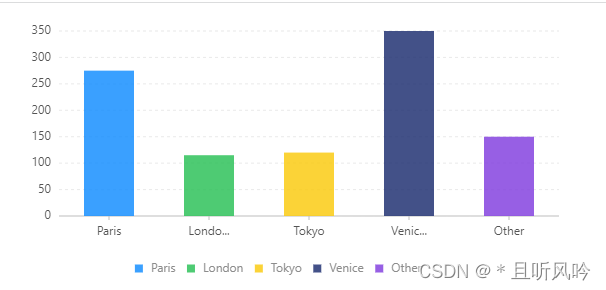
const data = [
{
city: 'Paris', count: 275 },
{
city: 'London', count: 115 },
{
city: 'Tokyo', count: 120 },
{
city: 'Venice', count: 350 },
{
city: 'Other', count: 150 }
]; // G2 对数据源格式的要求,仅仅是 JSON 数组,数组的每个元素是一个标准 JSON 对象。
// Step 1: 创建 Chart 对象
const chart = new G2.Chart({
container: 'c1', // 指定图表容器 ID
width: 600, // 指定图表宽度
height: 300 // 指定图表高度
});
// Step 2: 载入数据源
chart.source(data);
// 格式化文字,超过长度添加省略号
chart.axis('city', {
label: {
formatter: (text) => {
// 字符太长添加省略号
return text.length > 5 ? `${
text.slice(0, 5)}...` : text;
}
}
})
// Step 3:创建图形语法,绘制柱状图,由 city 和 count 两个属性决定图形位置,city 映射至 x 轴,count 映射至 y 轴
chart.interval().position('city*count').color('city')
// Step 4: 渲染图表
chart.render();
</script>
</body>
</html>
页面效果: