- 简单阈值
函数:threshold(src, thresh, maxval, type, dst=None)
函数中四个参数分别是原图像、阈值、最大值、阈值类型
阈值类型一般分为五种:
cv2.THRESH_BINARY:大于阈值的部分像素值变为maxval,其他变为0
cv2.THRESH_BINARY_INV:大于阈值的部分变为0,其他部分变为最大值
cv2.THRESH_TRUNC:大于阈值的部分变为阈值,其余部分不变
cv2.THRESH_TOZERO:大于阈值的部分不变,其余部分变为0
cv2.THRESH_TOZERO_INV:大于阈值的部分变为0,其余部分不变
1 import numpy as np
2 import cv2
3 from matplotlib import pyplot as plt
4
5 # 读取灰度图
6 img = cv2.imread("../image/sight.jpg", 0)
7
8 ret1, thresh1 = cv2.threshold(img, 127, 255, cv2.THRESH_BINARY)
9 ret2, thresh2=cv2.threshold(img, 127, 255, cv2.THRESH_BINARY_INV)
10 ret3, thresh3=cv2.threshold(img, 127, 255, cv2.THRESH_TRUNC)
11 ret4, thresh4=cv2.threshold(img, 127, 255, cv2.THRESH_TOZERO)
12 ret5, thresh5=cv2.threshold(img, 127, 255, cv2.THRESH_TOZERO_INV)
13
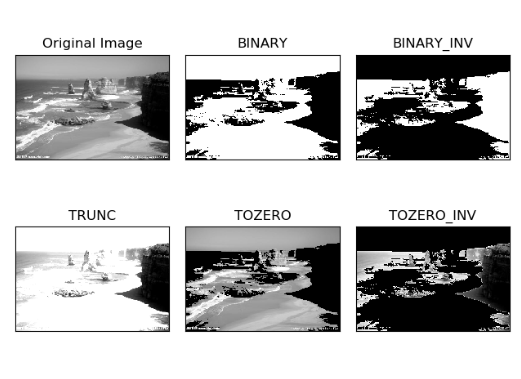
14 titles = ['Original Image','BINARY','BINARY_INV','TRUNC','TOZERO','TOZERO_INV']
15 images = [img, thresh1, thresh2, thresh3, thresh4, thresh5]
16 for i in range(6):
17 plt.subplot(2,3,i + 1),plt.imshow(images[i], 'gray')
18 plt.title(titles[i])
19 plt.xticks([]), plt.yticks([])
20 plt.show()
结果:
- 自适应阈值
在前面的部分我们使用是全局阈值,整幅图像采用同一个数作为阈值。当时这种方法并不适应与所有情况,尤其是当同一幅图像上的不同部分的具有不同亮度时。这种情况下我们需要采用自适应阈值。此时的阈值是根据图像上的每一个小区域计算与其对应的阈值。因此在同一幅图像上的不同区域采用的是不同的阈值,从而使我们能在亮度不同的情况下得到更好的结果。
adaptiveThreshold(src, maxValue, adaptiveMethod, thresholdType, blockSize, C, dst=None)
这种方法需要我们指定六个参数,返回值只有一个。
• Adaptive Method- 指定计算阈值的方法。
– cv2.ADPTIVE_THRESH_MEAN_C:阈值取自相邻区域的平均值
– cv2.ADPTIVE_THRESH_GAUSSIAN_C:阈值取值相邻区域的加权和,权重为一个高斯窗口。
• Block Size - 邻域大小(用来计算阈值的区域大小)。
• C - 这就是是一个常数,阈值就等于的平均值或者加权平均值减去这个常数。
代码:
1 import numpy as np
2 import cv2
3 from matplotlib import pyplot as plt
4
5 # 读取灰度图
6 img = cv2.imread("../image/sight.jpg", 0)
7
8 # 中值滤波,用来平滑图像,去除噪声
9 img = cv2.medianBlur(img, 5)
10
11 # 简单阈值
12 ret, thresh1 = cv2.threshold(img, 127, 255, cv2.THRESH_BINARY)
13
14 # 自适应,阈值取相邻区域的平均值
15 thresh2 = cv2.adaptiveThreshold(img, 255, cv2.ADAPTIVE_THRESH_MEAN_C, cv2.THRESH_BINARY, 11, 2)
16
17 # 自适应,阈值取值相邻区域的加权和,权重为一个高斯窗口。
18 thresh3 = cv2.adaptiveThreshold(img, 255, cv2.ADAPTIVE_THRESH_GAUSSIAN_C, cv2.THRESH_BINARY, 11, 2)
19
20
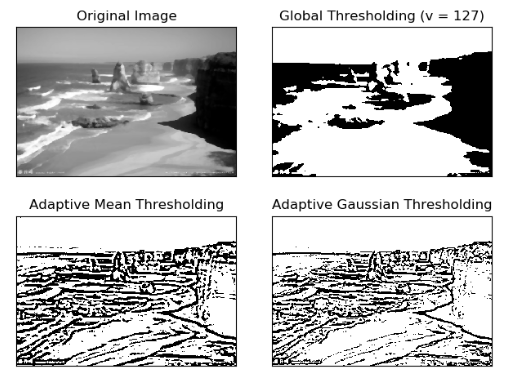
21 titles = ['Original Image', 'Global Thresholding (v = 127)',
22 'Adaptive Mean Thresholding', 'Adaptive Gaussian Thresholding']
23 images = [img, thresh1, thresh2, thresh3]
24 for i in range(4):
25 plt.subplot(2,2,i+1),plt.imshow(images[i],'gray')
26 plt.title(titles[i])
27 plt.xticks([]),plt.yticks([])
28 plt.show()
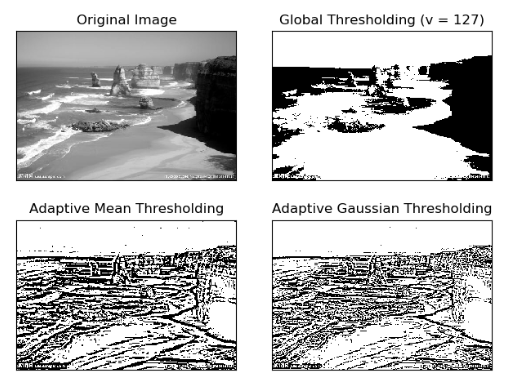
结果:
如果不进行滤波处理,会出现噪声,如下图所示: