React Native 集成native-echarts(图表插件)及代码示例
1、安装
npm install --save native-echarts
2、解决Android环境中图表不显示问题
#拷贝tpl.html
复制node_modules\native-echarts\src\components\Echarts\tpl.html文件、到android/app/src/main/assets文件夹下。

#修改native-echarts入口文件
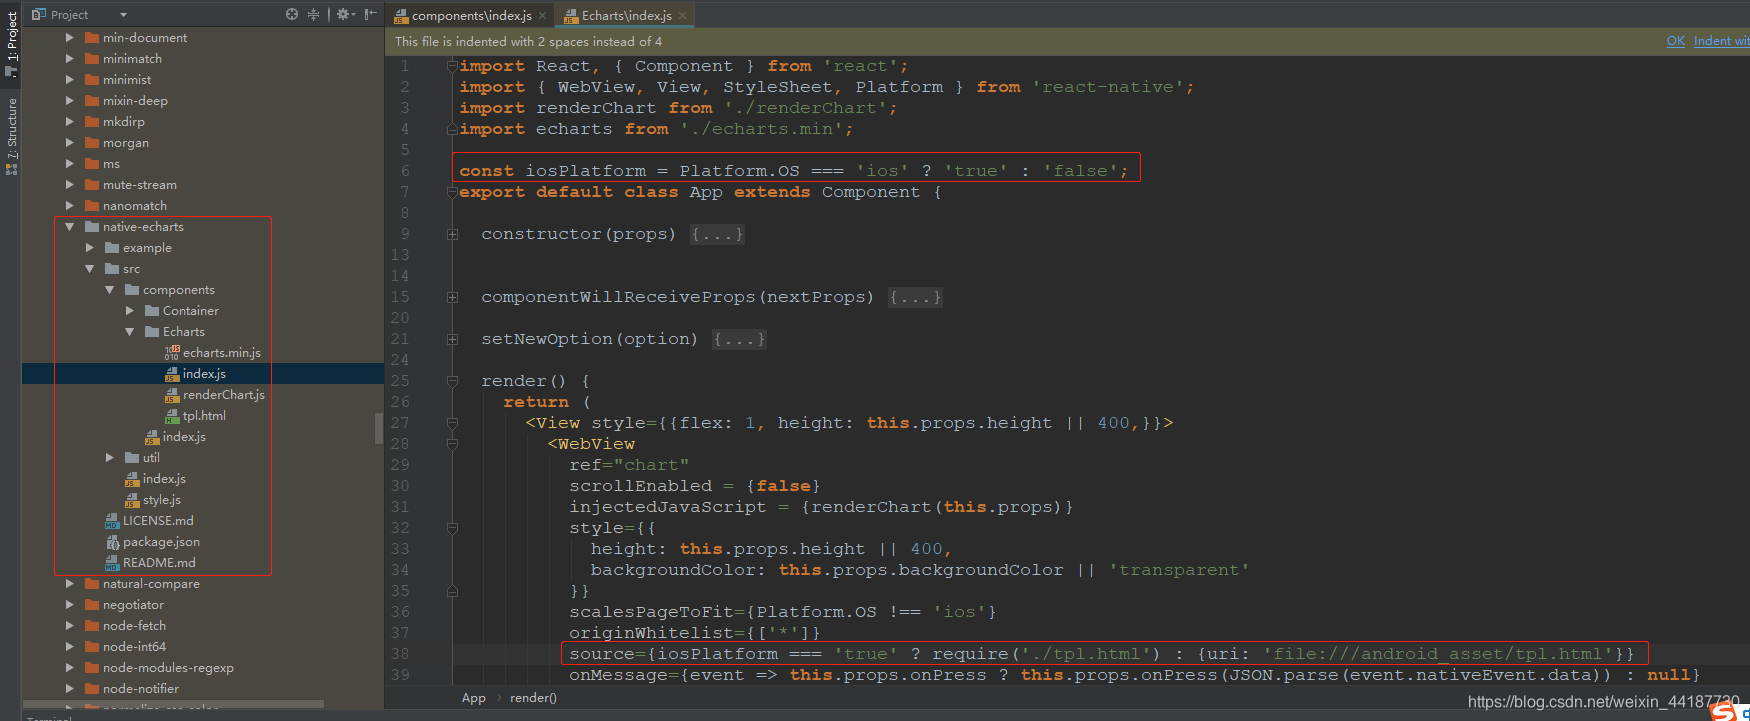
修改node_modules/native-echarts/src/components/Echarts/index.js文件
#修改内容
const iosPlatform = Platform.OS === 'ios' ? 'true' : 'false';
source={iosPlatform === 'true' ? require('./tpl.html') : {uri: 'file:///android_asset/tpl.html'}}
3、解决页面过度渲染闪烁问题
1):替换node_modules\native-echarts\src\components\Echarts目录下、index.js和renderChart.js文件,内容如下:
2):index.js
import React, {Component} from 'react';
import {WebView, View, StyleSheet, Platform} from 'react-native';
import renderChart from './renderChart';
import renderChartNoFirst from './renderChart'
import echarts from './echarts.min';
const iosPlatform = Platform.OS === 'ios' ? 'true' : 'false';
export default class App extends Component {
shouldComponentUpdate(nextProps, nextState) {
const thisProps = this.props || {}
nextProps = nextProps || {}
if (Object.keys(thisProps).length !== Object.keys(nextProps).length) {
return true
}
for (const key in nextProps) {
if (JSON.stringify(thisProps[key]) != JSON.stringify(nextProps[key])) {
return true
}
}
return false
}
componentWillReceiveProps(nextProps) {
if (nextProps.option !== this.props.option) {
this.refs.chart.injectJavaScript(renderChart(nextProps, false))
}
}
render() {
return (
<View style={{flex: 1, height: this.props.height || 400}}>
<WebView
ref="chart"
scrollEnabled={false}
injectedJavaScript={renderChart(this.props, true)}
style={{
height: this.props.height || 400,
}}
source={iosPlatform === 'true' ? require('./tpl.html') : {uri: 'file:///android_asset/tpl.html'}}
/>
</View>
);
}
}
3):renderChart.js
import echarts from './echarts.min';
import toString from '../../util/toString';
var myChart = null;
export default function renderChart(props,isFirst) {
    const height = props.height || 400;
    if (isFirst){
        return `
    document.getElementById('main').style.height = "${height}px";
    myChart = echarts.init(document.getElementById('main'));
    myChart.setOption(${toString(props.option)});
  `
    }else{
        return `
    document.getElementById('main').style.height = "${height}px";

    myChart.setOption(${toString(props.option)});
  `
    }
}
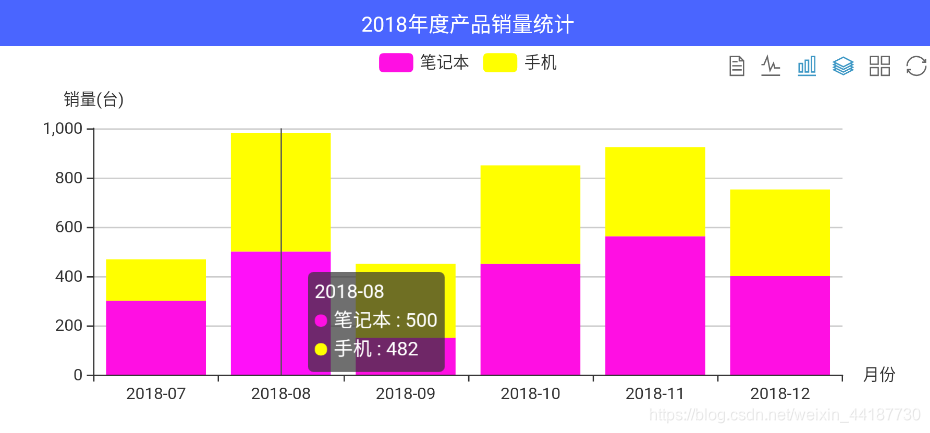
4、效果演示
1):EchartsExample.js
import React, {Component} from 'react';
import {Platform, StyleSheet, Text, TouchableOpacity, View} from 'react-native';
import Echarts from 'native-echarts';
export default class EchartsExample extends Component {
constructor() {
super(...arguments);
}
state = {
pcData: [300, 500, 150, 450, 562, 400],
phoneData: [168, 482, 300, 400, 362, 352],
xData: ['2018-07', '2018-08', '2018-09', '2018-10', '2018-11', '2018-12',]
};
render() {
const option = {
tooltip: {
trigger: 'axis'
},
legend: {
data: ['笔记本', '手机']
},
toolbox: {
show: true,
showTitle: true,
feature: {
dataView: {show: true, readOnly: false},
magicType: {
type: ['line', 'bar', 'stack', 'tiled'],
},
restore: {show: true}
}
},
xAxis: [
{
boundaryGap: true,
type: 'category',
name: '月份',
data: this.state.xData
}
],
yAxis: [
{
type: 'value',
name: '销量(台)'
}
],
color: ['#ff0fe3', '#ffff00'],
series: [
{
name: '笔记本',
type: 'bar',
data: this.state.pcData
},
{
name: '手机',
type: 'bar',
data: this.state.phoneData
}
]
};
return (
<View style={styles.container}>
<View style={styles.titleView}>
<TouchableOpacity>
<Text style={styles.title}>2018年度产品销量统计</Text>
</TouchableOpacity>
</View>
<Echarts option={option} height={300}/>
</View>
);
}
}
const styles = StyleSheet.create({
container: {
flex: 1
},
titleView: {
height: Platform.OS === 'ios' ? 64 : 34,
paddingTop: Platform.OS === 'ios' ? 14 : 0,
backgroundColor: '#4a65ff',
justifyContent: 'center',
alignItems: 'center',
flexDirection: 'row'
},
title: {
color: 'white',
fontSize: 15,
textAlign: 'center'
},
});
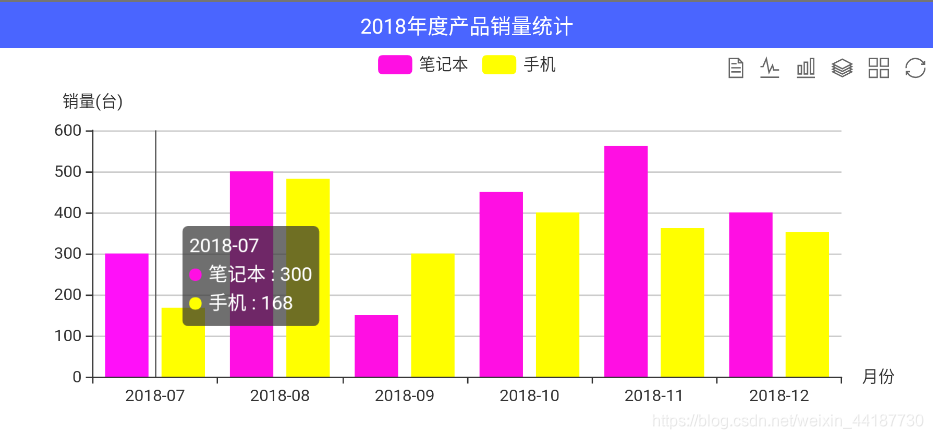
2):基本视图
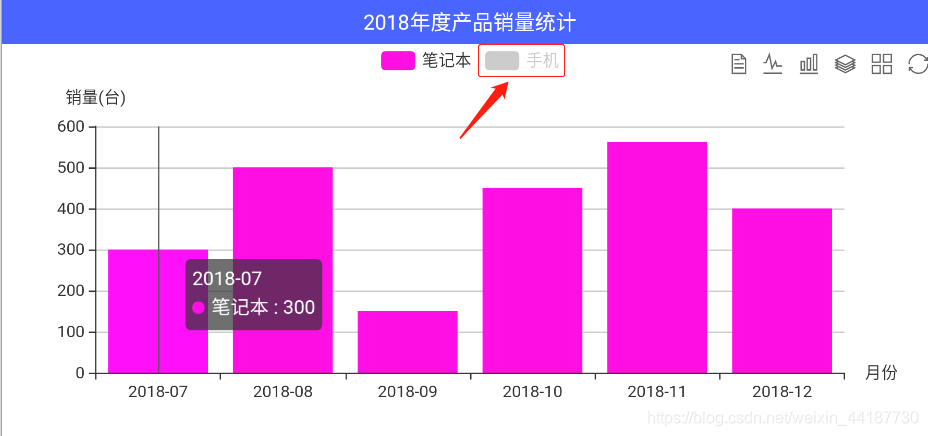
3):单一视图
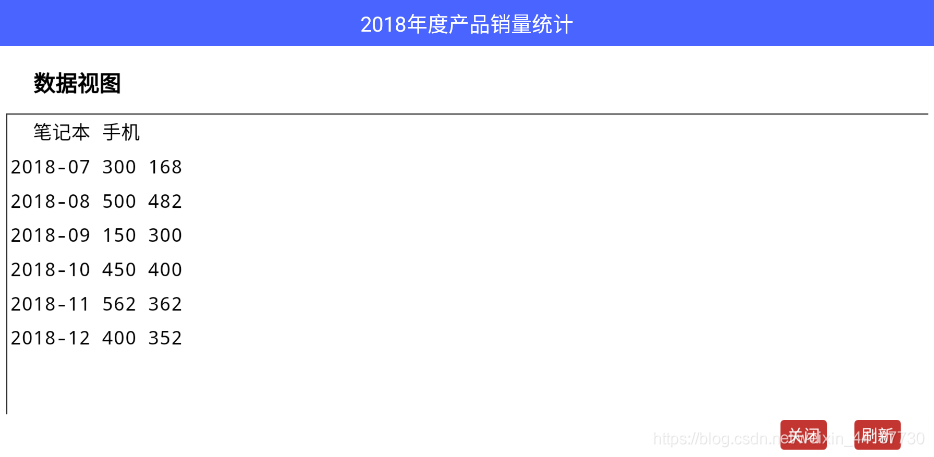
4):数据视图
5):折线视图

6):层叠视图
5、其他参考