版权声明:本文为博主([email protected])原创文章,未经博主允许不得转载。 https://blog.csdn.net/z_feng12489/article/details/89450200
4.6 高阶操作
Outline
- where 根据坐标 有目的性的选择
- scatter_nd 根据坐标 有目的性的更新
- meshgrid 生成坐标系
where
where(tensor)

a = tf.random.normal([3, 3])

mask = a>0
# <tf.Tensor: id=46, shape=(3, 3), dtype=bool, numpy=
# array([[ True,  True,  True],
#        [False,  True,  True],
#        [ True,  True,  True]])>

tf.boolean_mask(a, mask)
# <tf.Tensor: id=128, shape=(8,), dtype=float32, numpy=
# array([0.469083  , 0.78703344, 2.418932  , 1.9637926 , 0.31090873,
#        0.11894408, 0.70458823, 0.00413397], dtype=float32)>

indices = tf.where(mask)
# <tf.Tensor: id=35, shape=(8, 2), dtype=int64, numpy=
# array([[0, 0],
#        [0, 1],
#        [0, 2],
#        [1, 1],
#        [1, 2],
#        [2, 0],
#        [2, 1],
#        [2, 2]], dtype=int64)>

tf.gather_nd(a, indices)
# <tf.Tensor: id=82, shape=(8,), dtype=float32, numpy=
# array([0.469083  , 0.78703344, 2.418932  , 1.9637926 , 0.31090873,
#        0.11894408, 0.70458823, 0.00413397], dtype=float32)>
注:
- tf.boolean_mask(a, mask) => mask 同型的掩码。
- tf.gather_nd(a, indices) => indices 符合维度的坐标。
- 返回同为 长向量。
- tf.where(mask) 返回 indices。
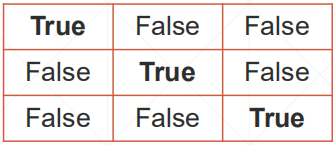
where(cond, A, B)
mask
# <tf.Tensor: id=46, shape=(3, 3), dtype=bool, numpy=
# array([[ True,  True,  True],
#        [False,  True,  True],
#        [ True,  True,  True]])>

A = tf.ones([3,3])
# <tf.Tensor: id=178, shape=(3, 3), dtype=float32, numpy=
# array([[1., 1., 1.],
#        [1., 1., 1.],
#        [1., 1., 1.]], dtype=float32)>

B = tf.zeros([3,3])
# <tf.Tensor: id=181, shape=(3, 3), dtype=float32, numpy=
# array([[0., 0., 0.],
#        [0., 0., 0.],
#        [0., 0., 0.]], dtype=float32)>

tf.where(mask, A, B)
# <tf.Tensor: id=308, shape=(3, 3), dtype=float32, numpy=
# array([[1., 1., 1.],
#        [0., 1., 1.],
#        [1., 1., 1.]], dtype=float32)>
注:
- A,B 同形
- cond[i, j, …] 为 True 取 A[i, j, …] ; False 取 B[i, j, …]
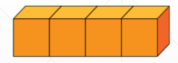
scatter_nd
- tf.scatter_nd(
- indices,
- updates,
- shape
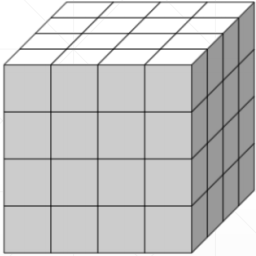
one dim
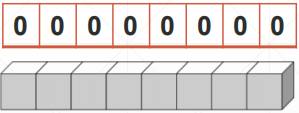
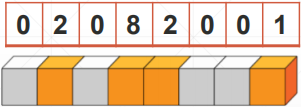
updates shape output
indices = tf.constant([[4],[3],[1],[7]])
updates = tf.constant([9, 10, 11, 12])
shape = tf.constant([8])

tf.scatter_nd(indices, updates, shape)
# <tf.Tensor: id=351, shape=(8,), dtype=int32, numpy=array([ 0, 11,  0, 10,  9,  0,  0, 12])>
multi-dim
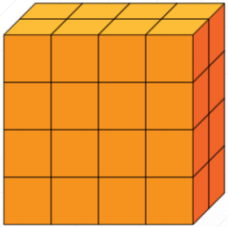
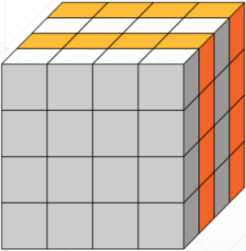
updates shape output
indices = tf.constant([[0],[2]])
updates = tf.constant([   [[5, 5, 5, 5],[6, 6, 6, 6],
                           [7, 7, 7, 7],[8, 8, 8, 8]],
                          [[5, 5, 5, 5], [6, 6, 6, 6],
                          [7, 7, 7, 7], [8, 8, 8, 8]]])


shape = tf.constant([4, 4, 4])
tf.scatter_nd(indices, updates, shape)
# <tf.Tensor: id=1087, shape=(4, 4, 4), dtype=int32, numpy=
# array([[[5, 5, 5, 5],
#         [6, 6, 6, 6],
#         [7, 7, 7, 7],
#         [8, 8, 8, 8]],
#        [[0, 0, 0, 0],
#         [0, 0, 0, 0],
#         [0, 0, 0, 0],
#         [0, 0, 0, 0]],
#        [[5, 5, 5, 5],
#         [6, 6, 6, 6],
#         [7, 7, 7, 7],
#         [8, 8, 8, 8]],
#        [[0, 0, 0, 0],
#         [0, 0, 0, 0],
#         [0, 0, 0, 0],
#         [0, 0, 0, 0]]])>
meshgrid
- [-2, -2]
- [-1, -2]
- [ 0, -2]
- [-2,-1]
- [-1,-1]
- …
- [ 2, 2]

points
- [y, x, 2]
- [5, 5, 2]
- [N, 2]

numpy 实现
import numpy as np
def meshgrid():
    points = []

    for y in np.linspace(-2, 2, 5):
        for x in np.linspace(-2, -2, 5):
            points.append([x,y])
    return np.array(points)
注:
- numpy 实现 无法GPU加速。
- 用 tensorflow 实现 可 GPU 加速。
tensorflow 实现
y = tf.linspace(-2., 2, 5)
# <tf.Tensor: id=65, shape=(5,), dtype=float32, numpy=array([-2., -1.,  0.,  1.,  2.], dtype=float32)>
x = tf.linspace(-2., 2, 5)
# <tf.Tensor: id=90, shape=(5,), dtype=float32, numpy=array([-2., -1.,  0.,  1.,  2.], dtype=float32)>

points_x, points_y = tf.meshgrid(x, y)
points_x.shape
points_x
<tf.Tensor: id=206, shape=(5, 5), dtype=float32, numpy=
array([[-2., -1.,  0.,  1.,  2.],
       [-2., -1.,  0.,  1.,  2.],
       [-2., -1.,  0.,  1.,  2.],
       [-2., -1.,  0.,  1.,  2.],
       [-2., -1.,  0.,  1.,  2.]], dtype=float32)>

points_y
<tf.Tensor: id=207, shape=(5, 5), dtype=float32, numpy=
array([[-2., -2., -2., -2., -2.],
       [-1., -1., -1., -1., -1.],
       [ 0.,  0.,  0.,  0.,  0.],
       [ 1.,  1.,  1.,  1.,  1.],
       [ 2.,  2.,  2.,  2.,  2.]], dtype=float32)>

points = tf.stack([points_x, points_y], axis=2)
# <tf.Tensor: id=368, shape=(5, 5, 2), dtype=float32, numpy=
# array([[[-2., -2.],
#         [-1., -2.],
#         [ 0., -2.],
#         [ 1., -2.],
#         [ 2., -2.]],
#        [[-2., -1.],
#         [-1., -1.],
#         [ 0., -1.],
#         [ 1., -1.],
#         [ 2., -1.]],
#        [[-2.,  0.],
#         [-1.,  0.],
#         [ 0.,  0.],
#         [ 1.,  0.],
#         [ 2.,  0.]],
#        [[-2.,  1.],
#         [-1.,  1.],
#         [ 0.,  1.],
#         [ 1.,  1.],
#         [ 2.,  1.]],
#        [[-2.,  2.],
#         [-1.,  2.],
#         [ 0.,  2.],
#         [ 1.,  2.],
#         [ 2.,  2.]]], dtype=float32)>
plot
import tensorflow as tf
import os
import matplotlib.pyplot as plt
os.environ['TF_CPP_MIN_LOG_LEVEL'] = '2'

def func(x):
    """
    :param x: [b, 2]
    :return:
    """
    z = tf.math.sin(x[...,0]) + tf.math.sin(x[...,1])

    return z


x = tf.linspace(0., 2*3.14, 500)
y = tf.linspace(0., 2*3.14, 500)
# [50, 50]
point_x, point_y = tf.meshgrid(x, y)
# [50, 50, 2]
points = tf.stack([point_x, point_y], axis=2)
# points = tf.reshape(points, [-1, 2])
print('points:', points.shape)
z = func(points)
print('z:', z.shape)

plt.figure('plot 2d func value')
plt.imshow(z, origin='lower', interpolation='none')
plt.colorbar()

plt.figure('plot 2d func contour')
plt.contour(point_x, point_y, z)
plt.colorbar()
plt.show()
结果:

