Hystrix被设计的原则就是防止任何单个依赖项耗尽所有容器(如Tomcat)用户线程。它会甩掉包袱,快速失败而不是排队。在任何可行的地方提供回退,以保护用户不受失败的影响。使用隔离技术(如隔离板、泳道和断路器模式)来限制任何一个依赖项的影响。既可以通过近实时的度量、监视和警报来优化发现时间。也可以通过配置的低延迟传播来优化恢复时间。可以支持对Hystrix的大多数方面的动态属性更改,允许使用低延迟反馈循环进行实时操作修改。有效避免在整个依赖客户端执行中出现故障,而不仅仅是在网络流量中。
更通俗一点说就是一次请求往往需要依赖多个服务才能实现,然而在这一次请求中,某一个服务如果出现异常,则整个请求会处理失败;当某一服务等待时间过长,则所有的请求都会阻塞在这个服务的请求上。这样因为一个服务就导致了整个系统的不可用。组件Hystrix可以将这些请求隔离,针对服务限流,当服务不可用时能够熔断并降级,防止级联故障。
这篇文章介绍与设计Hystrix很详细,很推荐大家看一下这篇文章:https://blog.csdn.net/chenxyz707/article/details/80913725
我自己所写,只是我自己一个学习过程记录,希望对跟我一样学习的同学有帮助。
搭建一个简单的断路器监控(Hystrix Dashboard)可以大致分为三个步骤:
1、搭建一个服务注册中心。
2、搭建一个服务消费者用来被进行监控。
3、配置断路器监控的主要配置。
其中搭建一个Eureka Server服务注册中心很简单,这里不做详细介绍。
主要进行服务消费者配置断路器监控的主要配置:
在服务消费者 service-hi 添加如下依赖-(对应的spring cloud的版本是Greenwich.SR1)
<dependency>
   <groupId>org.springframework.boot</groupId>
   <artifactId>spring-boot-starter-actuator</artifactId>
</dependency>
<dependency>
   <groupId>org.springframework.cloud</groupId>
   <artifactId>spring-cloud-starter-netflix-eureka-client</artifactId>
   <version>2.1.1.RELEASE</version>
</dependency>
<dependency>
   <groupId>org.springframework.cloud</groupId>
   <artifactId>spring-cloud-starter-netflix-hystrix</artifactId>
</dependency>
<dependency>
   <groupId>org.springframework.cloud</groupId>
   <artifactId>spring-cloud-starter-netflix-hystrix-dashboard</artifactId>
</dependency>
在程序的启始类ServiceHiApplication中,加上@EnableHystrix注解开启断路器,这个是必须的;加上@EnableHystrixDashboard注解,开启HystrixDashboard
@SpringBootApplication
@EnableEurekaClient
@EnableHystrix
@EnableHystrixDashboard
@EnableCircuitBreaker
public class ServiceHiApplication {

   public static void main(String[] args) {
      SpringApplication.run(ServiceHiApplication.class, args);
   }

}
创建一个控制器,进行服务访问,并且需要在程序中声明断路点HystrixCommand
@RestController
public class ServiceHiController {
@Value("${server.port}")
String port;

@RequestMapping("/hi")
@HystrixCommand(fallbackMethod = "hiError")
public String sayHi(@RequestParam(value = "name") String name){
    return "Hi "+name+",i am from port: "+port;
}

public String hiError(String name){
    return "hi,"+name+",sorry,error!";
}
}
配置文件application.yml 如下-
server:
  port: 9090
spring:
  application:
    name: service-hi
management:
  endpoints:
    web:
      exposure:
        include: "*"
      cors:
        allowed-origins: "*"
        allowed-methods: "*"
在搭建的过程中,application.yml如果未配置如下配置-
management:
  endpoints:
    web:
      exposure:
        include: "*"
      cors:
        allowed-origins: "*"
        allowed-methods: "*"
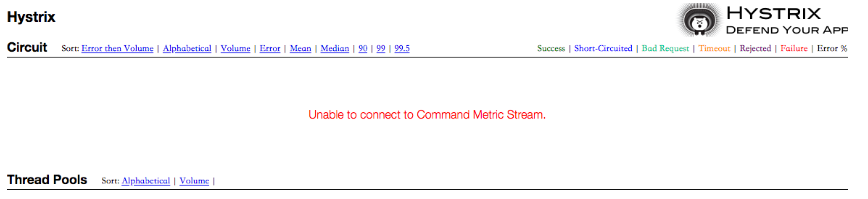
在访问http://localhost:9090/hystrix时会出现如下错误:页面会提示Unable to connect to Command Metric Stream。
一切准备好之后,运行程序:依次运行eureka server和service-hi。
访问http://localhost:9090/hystrix,可以看到如下页面

在页面上依次输入:http://localhost:9090/actuator/hystrix.stream 、2000 、hystrix;
点击Monitor Stream。其中delay、title可以根据实际需求进行填写。
重新打开另外一个窗口:访问http://localhost:9090/hi?name=jack
再重新刷新hystrix.stream网页,你会看到良好的图形化界面:
