一:Hystrix Dashboard简介
在微服务架构中为例保证程序的可用性,防止程序出错导致网络阻塞,出现了断路器模型。断路器的状况反应了一个程序的可用性和健壮性,它是一个重要指标。Hystrix Dashboard是作为断路器状态的一个组件,提供了数据监控和友好的图形化界面。
我们的工程基于上一篇文章中的工程,SpringBoot的版本为2.0.3
二:断路器监控的配置(基于SpringBoot2.0.3)
首先我们导入pom依赖,假如你的SpringBoot的版本为2.0以下的版本,那么pom只需要导入:
<dependency>
	<groupId>org.springframework.boot</groupId>
	<artifactId>spring-boot-starter-actuator</artifactId>
</dependency>
<dependency>
	<groupId>org.springframework.cloud</groupId>
	<artifactId>spring-cloud-starter-hystrix-dashboard</artifactId>
</dependency>
但是假如你的SpringBoot的版本为2.0以上的版本时候,比如我现在使用的是SpringBoot2.0.3版本,那么就需要导入如下的依赖,否则,就会出现@EnableHystrixDashboard类找不到的情况。
<!--spring-cloud-starter-hystrix-dashboard的起步依赖-->
<dependency>
	<groupId>org.springframework.boot</groupId>
	<artifactId>spring-boot-starter-actuator</artifactId>
</dependency>
<dependency>
	<groupId>org.springframework.cloud</groupId>
	<artifactId>spring-cloud-starter-netflix-hystrix-dashboard</artifactId>
</dependency>
在主程序启动类中加入@EnableHystrixDashboard注解,开启hystrixDashboard。
@EnableEurekaClient
@SpringBootApplication
@EnableFeignClients
@EnableHystrix
@EnableHystrixDashboard
public class MallManagerServiceApplication {

	public static void main(String[] args) {
		SpringApplication.run(MallManagerServiceApplication.class, args);
	}

}
打开浏览器:访问http://localhost:8011/hystrix,界面如下
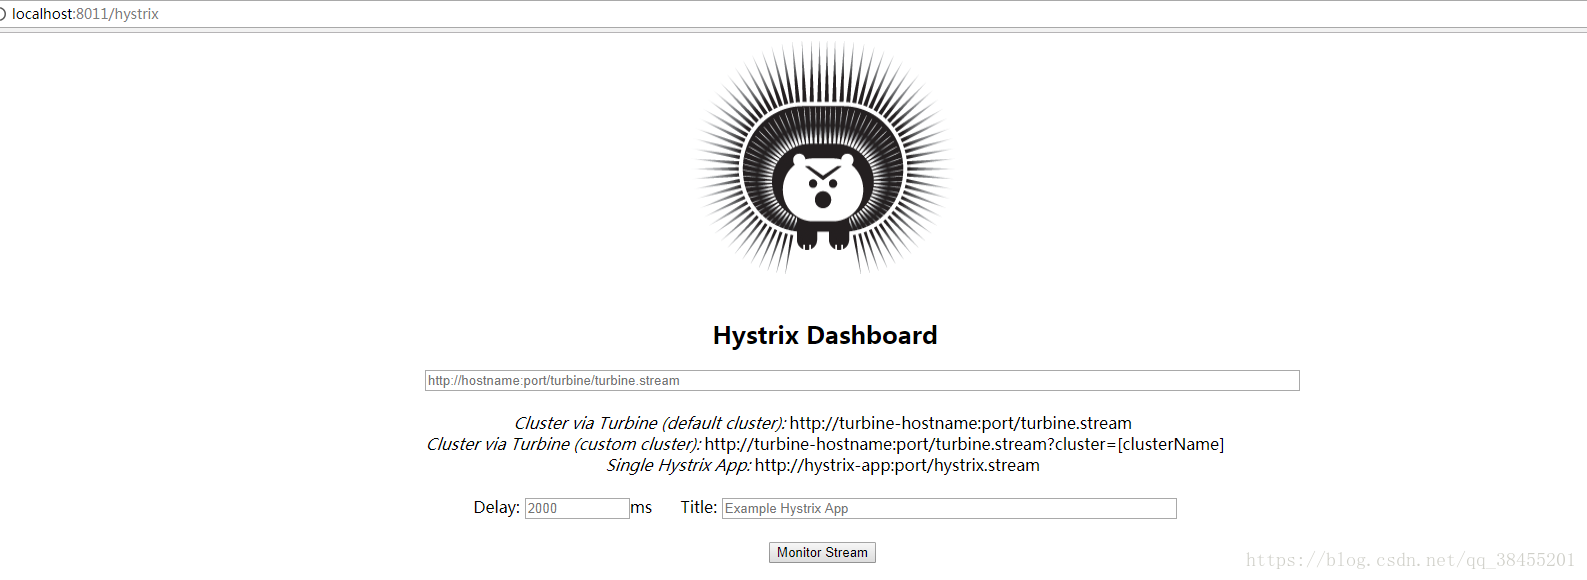

页面提示Unable to connect to Command Metric Stream。
如何解决?
我们只需要在application.yml配置文件当中引入如下配置:注意最后的*一定要加上引号,不然会启动报错。
#management.endpoints.web.exposure.include=*
management:
    endpoints:
       web:
          exposure:
             include: "*"
我们输入框当中输入的不能是http://localhost:8011/hystrix.stream,而是http://localhost:8011/actuator/hystrix.stream
再次进入页面,发现一直在显示Loading....
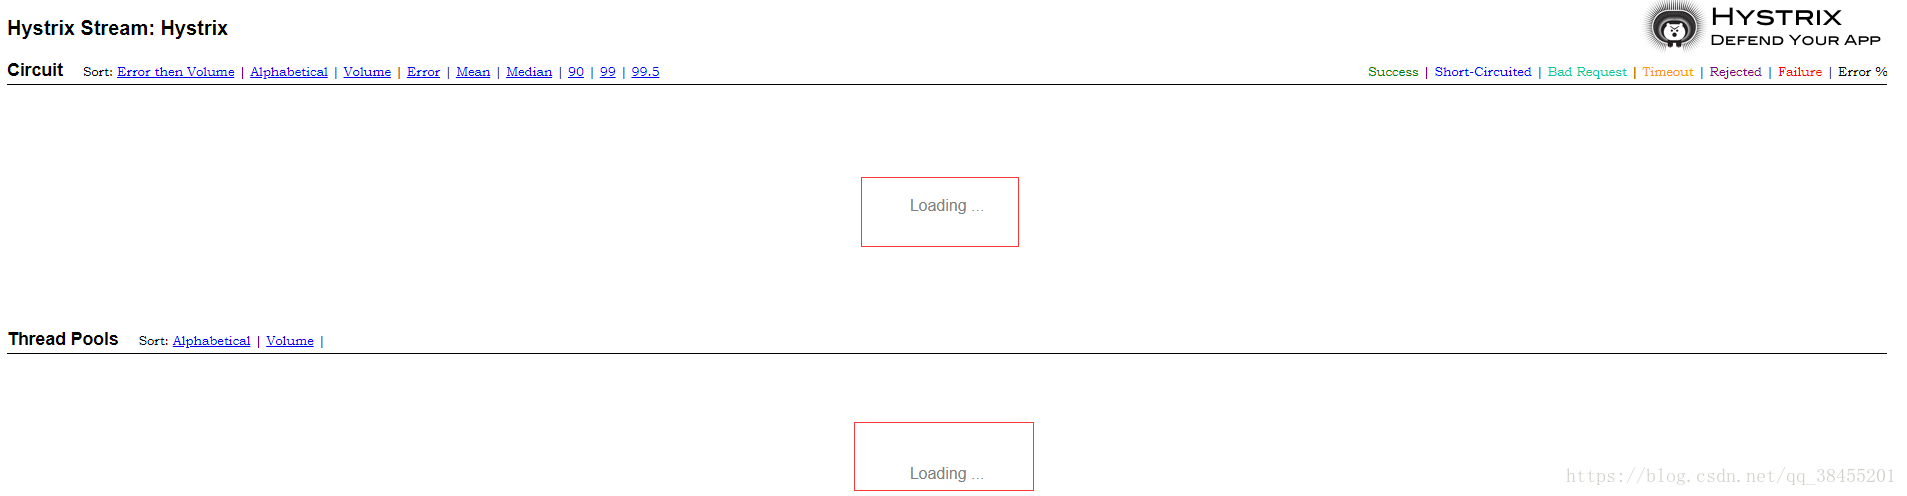
这个时候,我们只需要去访问几次提供熔断的方法就可以解决了,因为现在我们还没有访问过熔断的方法,系统找不到数据。
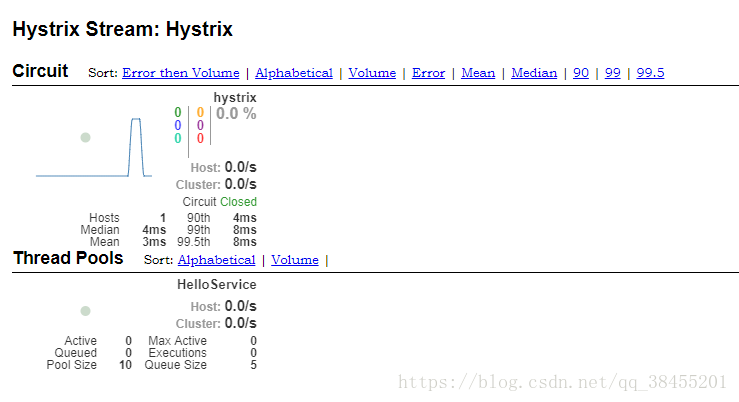
我们多访问几次熔断方法,比如上一篇文章当中:http://localhost:8011/sayHelloAA,刷新仪表盘,看到如下页面。