使用Kubernetes演示金丝雀发布
为了更直观的看出金丝雀发布的效果,我们这里使用了Prometheus监控来观察这个过程。不知道怎么使用Prometheus的同学请看使用Prometheus监控Kubernetes集群,另外我们这里使用一个Python程序来作为我们要发布的程序。
如何让Prometheus监控自定义程序
要想让Prometheus监控你的程序,你的程序运行在容器里,而容器有被POD这种资源形式所管理,那么监控程序就是监控POD,所以首先你就需要在POD文件中声明该POD需要被Prometheus抓取,这就需要通过一个标识来完成。
在Prometheus的配置文件中由于使用了Kubernetes自动发现,那么它会有这么一端配置内容,
global:
  scrape_interval: 10s
  evaluation_interval: 30s
scrape_configs:
......
# 抓取POD进行监控
- job_name: 'kubernetes-pods'

  kubernetes_sd_configs:
  - role: pod
  relabel_configs:
  # POD的 annotation 中含有"prometheus.io/scrape: true" 的则保留,
  # 意思就是会被Prometheus抓取,不具有这个的POD则不会被抓取
  - action: keep
    regex: true
    source_labels:
    - __meta_kubernetes_pod_annotation_prometheus_io_scrape
  # 获取POD的 annotation 中定义的"prometheus.io/path: XXX"定义的值,
  # 这个值就是你的程序暴露符合prometheus规范的metrics的地址,如果你的
  # metrics的地址不是 /metrics 的话,通过这个标签说,那么这里就会把这个
  # 值赋值给 __metrics_path__这个变量,因为prometheus是通过这个变量
  # 获取路径然后进行拼接出来一个完整的URL,并通过这个URL来获取metrics值的,
  # 因为prometheus默认使用的就是 http(s)://X.X.X.X/metrics
  # 这样一个路径来获取的。
  - action: replace
    regex: (.+)
    source_labels:
    - __meta_kubernetes_pod_annotation_prometheus_io_path
    target_label: __metrics_path__
  # 这里是端口信息,因为你的程序很有可能在容器中并不是以80端口运行的,
  # 那么就需要做一个拼接http(s)://x.x.x.x:xx/metrics
  # __address__在prometheus中代表的就是实例的IP地址,
  # 而POD中的annotation 中定义的"prometheus.io/port: XX"就是你程序
  # 被访问到的端口,最终在prometheus中将会被显示为 instance=X.X.X.X:XX这样
  - action: replace
    regex: ([^:]+)(?::\d+)?;(\d+)
    replacement: $1:$2
    source_labels:
    - __address__
    - __meta_kubernetes_pod_annotation_prometheus_io_port
    target_label: __address__

  - action: labelmap
    regex: __meta_kubernetes_pod_label_(.+)
  - source_labels: [__meta_kubernetes_namespace]
    action: replace
    target_label: kubernetes_namespace
  - source_labels: [__meta_kubernetes_pod_name]
    action: replace
    target_label: kubernetes_pod_name
所以最关键的就是在POD中配置上如下内容:
annotations:
prometheus.io/scrape: "true"
prometheus.io/port: "your port"
# 如果的metrics的路径就是 /metrics的话就不用配置下面的内容
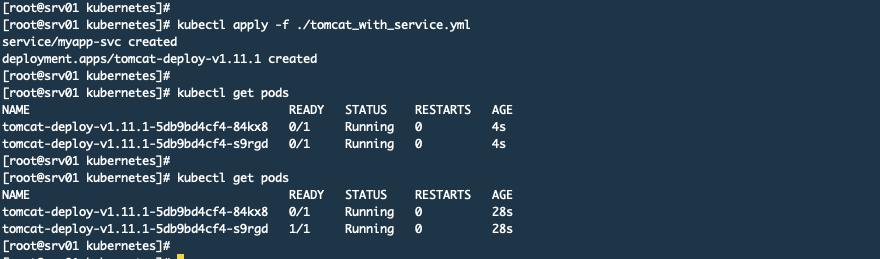
prometheus.io/path: "your path"但很多概念不清的人会发现你在POD中配置了这样的设置prometheus获取过来会报错,比如我这里使用了一个标准的tomcat镜像来启动2个POD,下面是deployment配置清单文件:
apiVersion: v1
kind: Service
metadata:
  name: myapp-svc
  labels:
    appname: myapp-svc
spec:
  type: ClusterIP
  ports:
  - name: tomcat-http
    port: 8080
    targetPort: 8080
  selector:
    appname: myapp
---
apiVersion: apps/v1
kind: Deployment
metadata:
  name: tomcat-deploy-v1.11.1
  labels:
    appname: myapp
spec:
  replicas: 2
  selector:
    matchLabels:
      appname: myapp
      release: 1.11.1
  template:
    metadata:
      name: myapp
      labels:
        appname: myapp
        release: 1.11.1
      annotations:
        prometheus.io/scrape: "true"
        prometheus.io/port: "8080"
    spec:
      containers:
      - name: myapp
        image: tomcat:8.5.38-jre8
        imagePullPolicy: IfNotPresent
        resources:
          requests:
            cpu: "250m"
            memory: "128Mi"
          limits:
            cpu: "500m"
            memory: "256Mi"
        ports:
        - name: http
          containerPort: 8080
          protocol: TCP
        livenessProbe:
          httpGet:
            path: /
            port: http
          initialDelaySeconds: 20
          periodSeconds: 10
          timeoutSeconds: 2
        readinessProbe:
          httpGet:
            path: /
            port: http
          initialDelaySeconds: 20
          periodSeconds: 10
  revisionHistoryLimit: 10
  strategy:
    rollingUpdate:
      maxSurge: 1
      maxUnavailable: 1
    type: RollingUpdate
然后我应用这个清单文件,如下图:
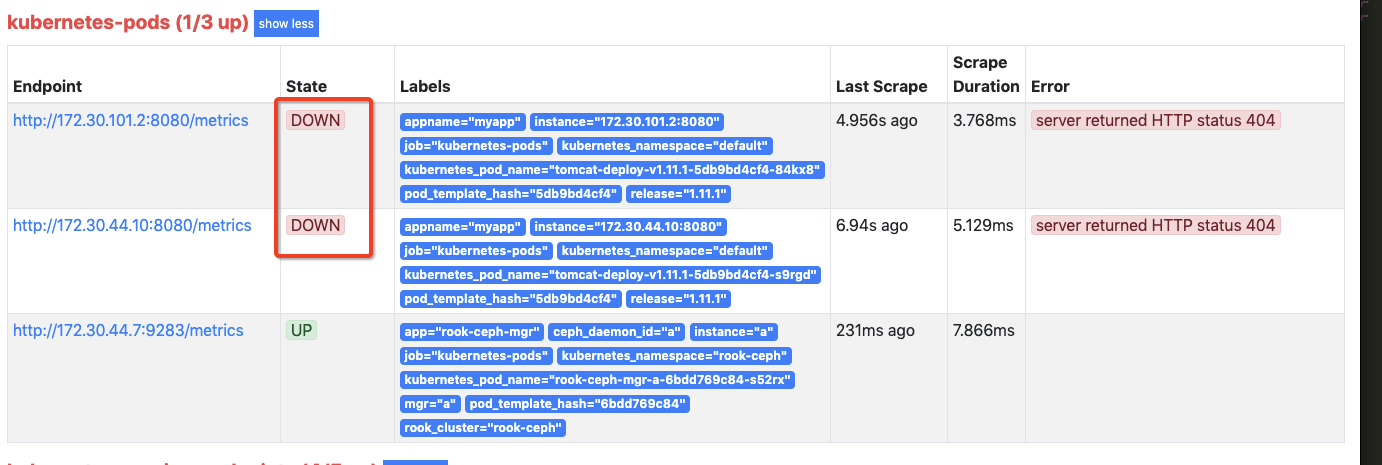
然后在Pormetheus中可以看到那2个POD已经被抓取了,但是状态为DOWN,如下图:
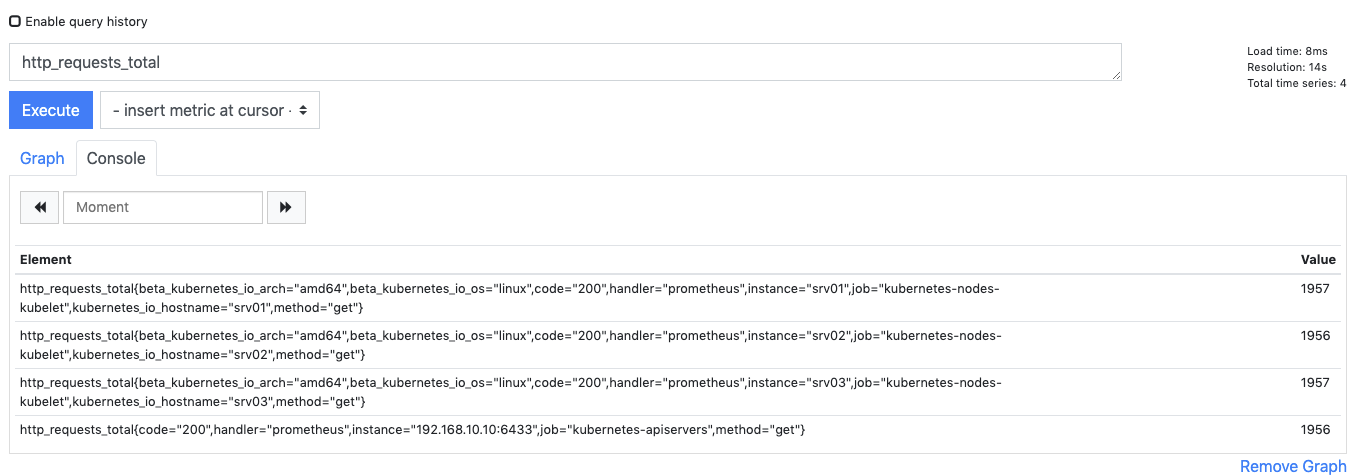
查询指标也是没有的
其原因就是因为标准Tomcat自带的应用没有/metrics这个路径,prometheus获取不到它能识别的格式数据,而指标数据就是从/metrics这里获取的。所以我们使用标准Tomcat不行或者你就算有这个/metrics这个路径,但是返回的格式不符合prometheus的规范也是不行的。
金丝雀发布我这里为什么非要让prometheus来监控呢?其实金丝雀发布和prometheus没关系,弄2个配置清单文件就可以了,但是为了更加直观的看出发布过程的流量情况我这里才使用了prometheus来监控这个过程,否则你很难有一个更加直观的认识,而且在实际工作中监控也是必须的尤其是对核心应用的升级。那么下面我们就自己制作一个符合prometheus指标规范的程序。
制作自定义程序
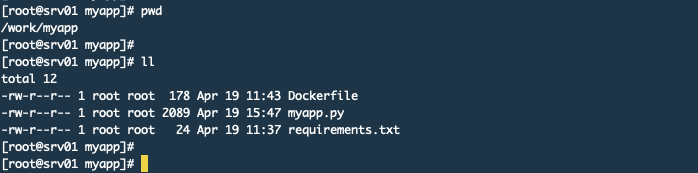
1. 设置目录结构
下面是目录结构
下面是myapp.py文件的内容
import prometheus_client
from prometheus_client import Counter, Gauge
from prometheus_client import Summary, CollectorRegistry
from flask import Response, Flask
import time
import random
import os


app = Flask(__name__)

# 定义一个注册器,注册器可以把指标都收集起来,然后最后返回注册器数据
REGISTRY = CollectorRegistry(auto_describe=False)

# 定义一个Counter类型的变量,这个变量不是指标名称,这种Counter类型只增加
# 不减少,程序重启的时候会被重新设置为0,构造函数第一个参数是定义 指标名称,
# 第二个是定义HELP中显示的内容,都属于文本
# 第三个参数是标签列表,也就是给这个指标加labels,这个也可以不设置
http_requests_total = Counter("http_requests", "Total request cout of the host", ['method', 'endpoint'], registry=REGISTRY)

# Summary类型,它可以统计2个时间
# request_processing_seconds_count 该函数被调用的数量
# request_processing_seconds_sum  该函数执行所花的时长
request_time = Summary('request_processing_seconds', 'Time spent processing request', registry=REGISTRY)


@app.route("/metrics")
def requests_count():
    """
    当访问/metrics这个URL的时候就执行这个方法,并返回相关信息。
    :return:
    """
    return Response(prometheus_client.generate_latest(REGISTRY),
                    mimetype="text/plain")

# 这个是健康检查用的
@app.route('/healthy')
def healthy():
    return "healthy"


@app.route('/')
@request_time.time()  # 这个必须要放在app.route的下面
def hello_world():
    # .inc()表示增加,默认是加1,你可以设置为加1.5,比如.inc(1.5)
    # http_requests_total.inc()
    # 下面这种写法就是为这个指标加上标签,但是这里的method和endpoint
    # 都在Counter初始化的时候放进去的。
    # 你想统计那个ULR的访问量就把这个放在哪里
    http_requests_total.labels(method="get", endpoint="/").inc()
    # 这里设置0-1之间随机数用于模拟页面响应时长
    time.sleep(random.random())
    html = "Hello World!" \
           "App Version: {version}"
    # 这里我会读取一个叫做VERSION的环境变量,
    # 这个变量会随Dockerfile设置到镜像中
    return html.format(version=os.getenv("VERSION", "888"))


if __name__ == '__main__':
    app.run(host="0.0.0.0", port="5555")
下面是requirements.txt文件内容
Flask
prometheus_client
下面是Dockerfile文件的内容
# 使用官方提供的 Python 开发镜像作为基础镜像
FROM python:3.7.3-slim

# 创建目录
RUN mkdir /app

# 将工作目录切换为 /app 该目录为容器中的目录,相当于cd进入这个目录
WORKDIR /app

# 将Dockerfile所在目录下的这两个文件拷贝到 /app 下
ADD myapp.py requirements.txt /app/

# 使用 pip 命令安装这个应用所需要的依赖,这里通过-r指定依赖包的名称文件
RUN pip install --trusted-host mirrors.aliyun.com -r requirements.txt

# 允许外界访问容器的 5555 端口
EXPOSE 5555

# 设置版本号
ENV VERSION 1.0

# 设置容器进程为:python myapp.py,即:这个 Python 应用的启动命令
CMD ["python", "myapp.py"]
2. 使用Dockerfile制作镜像
使用下面的命令构建镜像docker build -t myapp:v1.0 .打完包,如下图
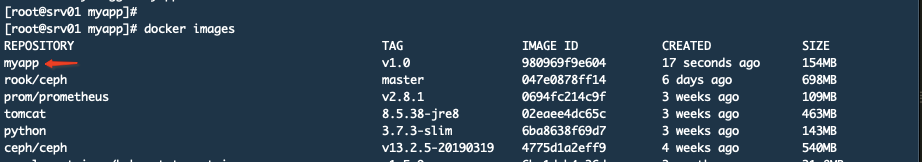
使用docker save -o myapp.tar myapp:v1.0命令导出该镜像,然后拷贝到Kubernetes集群中所有node节点上,然后使用这个命令进行导入docker load -i ./myapp.tar。
3. 编写Kubernetes的配置清单文件
其实这个配置清单文件我就是用上面那个Tomcat的文件修改的。
apiVersion: v1
kind: Service
metadata:
  name: myapp-svc
  labels:
    appname: myapp-svc
spec:
  type: ClusterIP
  ports:
  - name: http
    port: 5555
    targetPort: 5555
  selector:
    appname: myapp
---
apiVersion: apps/v1
kind: Deployment
metadata:
  name: myapp-deploy-v1.0
  labels:
    appname: myapp
spec:
  replicas: 4
  selector:
    matchLabels:
      appname: myapp
      release: 1.0.0
  template:
    metadata:
      name: myapp
      labels:
        appname: myapp
        release: 1.0.0
      annotations:
        prometheus.io/scrape: "true"
        prometheus.io/port: "5555"
    spec:
      containers:
      - name: myapp
        image: myapp:v1.0
        imagePullPolicy: IfNotPresent
        resources:
          requests:
            cpu: "250m"
            memory: "128Mi"
          limits:
            cpu: "500m"
            memory: "256Mi"
        ports:
        - name: http
          containerPort: 5555
          protocol: TCP
        livenessProbe:
          httpGet:
            path: /healthy
            port: http
          initialDelaySeconds: 20
          periodSeconds: 10
          timeoutSeconds: 2
        readinessProbe:
          httpGet:
            path: /healthy
            port: http
          initialDelaySeconds: 20
          periodSeconds: 10
  revisionHistoryLimit: 10
  strategy:
    rollingUpdate:
      maxSurge: 1
      maxUnavailable: 1
    type: RollingUpdate
应用文件
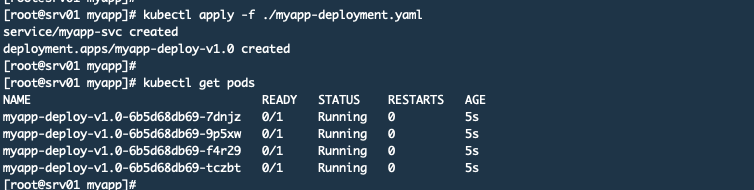
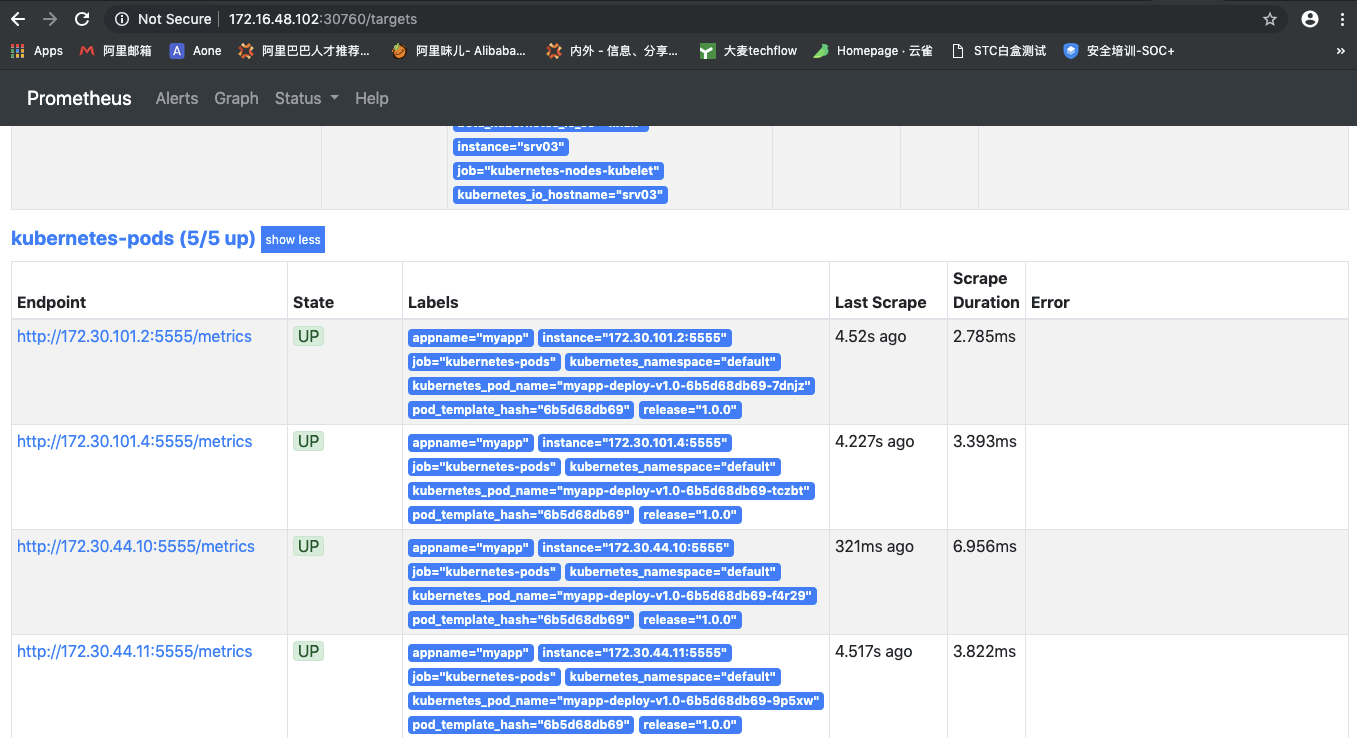
现在查看Prometheus的监控你可以看到你的程序了
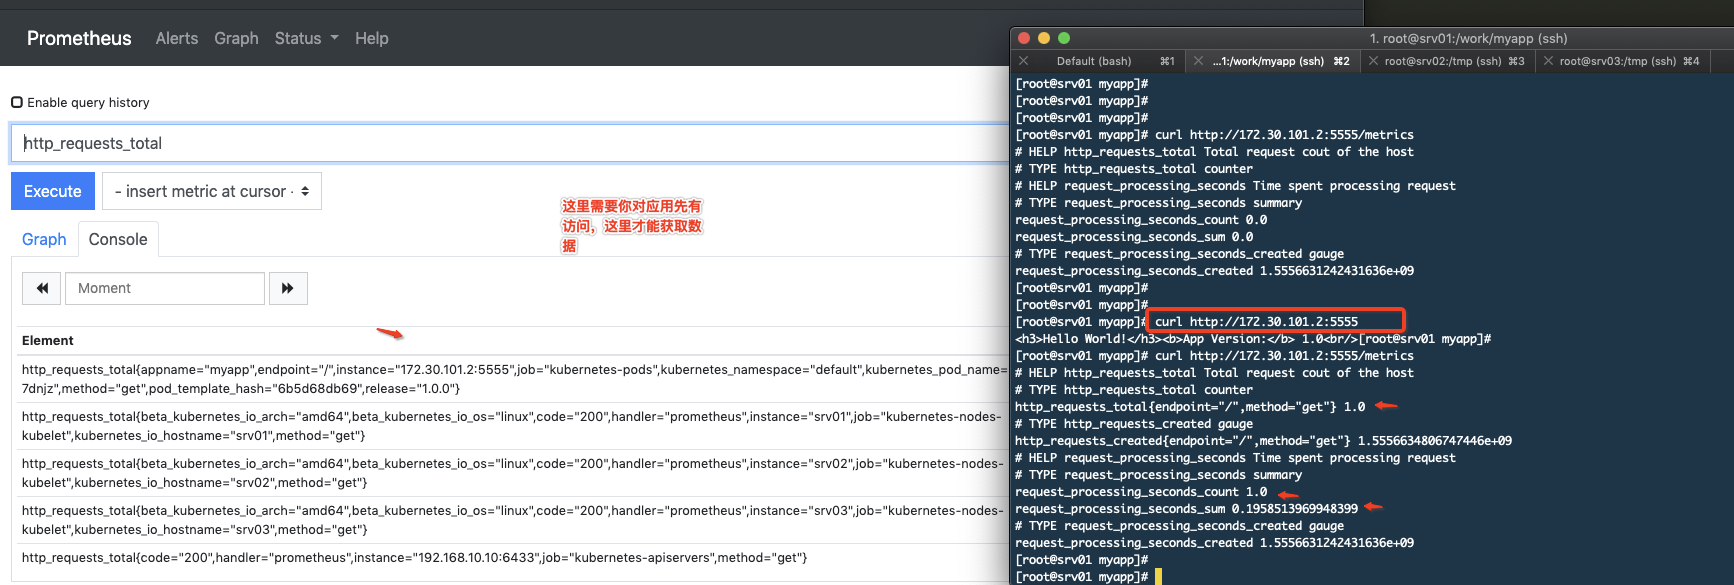
获取指标数据
4. 构建监控
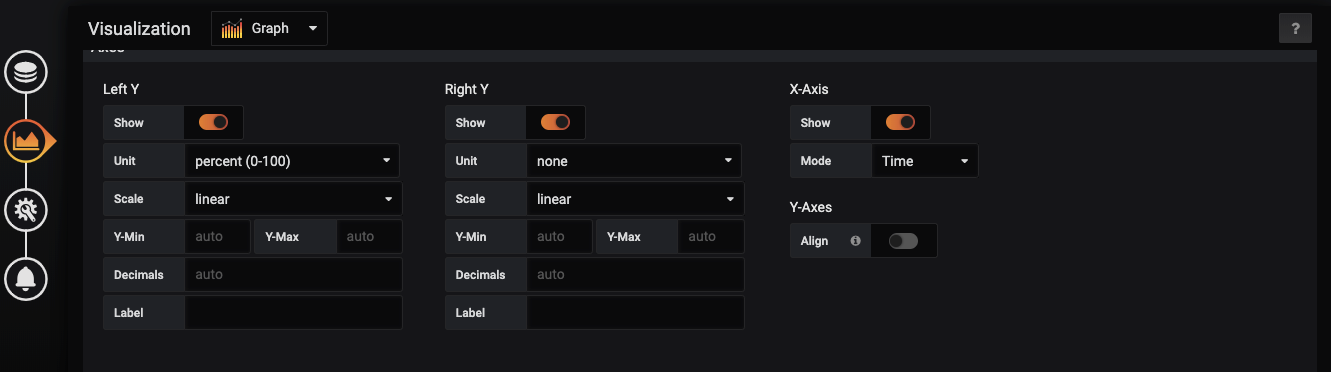
这里主要是在Grafana中建立一个图表来监控发布过程。
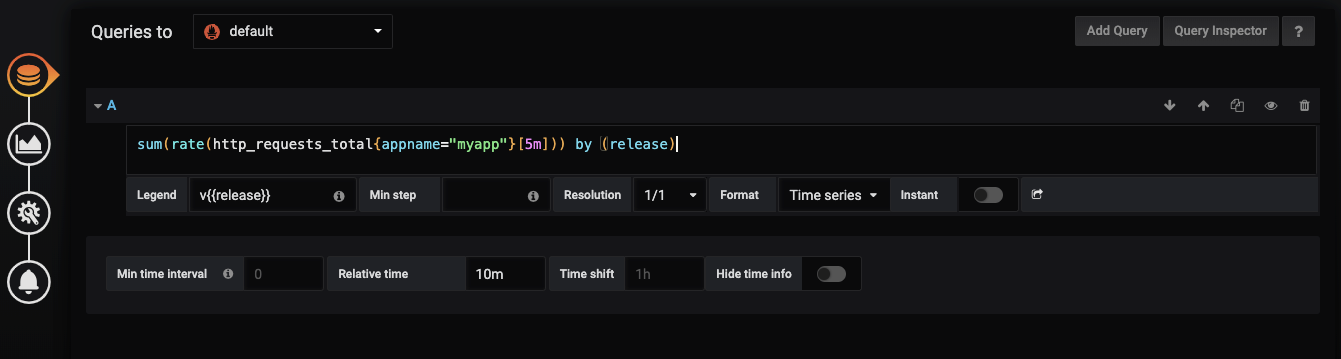
首先建立一个Graph的图表,然后按照下面的参数设置
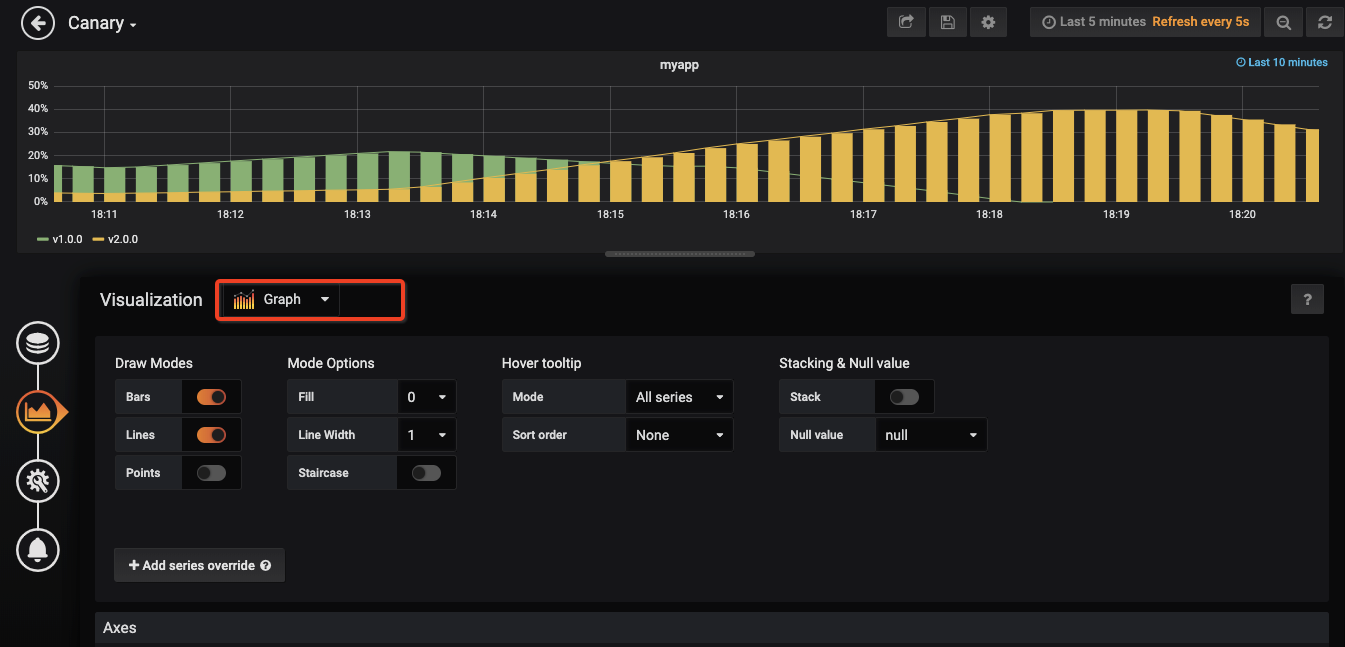
使用这个公式sum(rate(http_requests_total{appname="myapp"}[5m])) by (release)
再设置一个名字
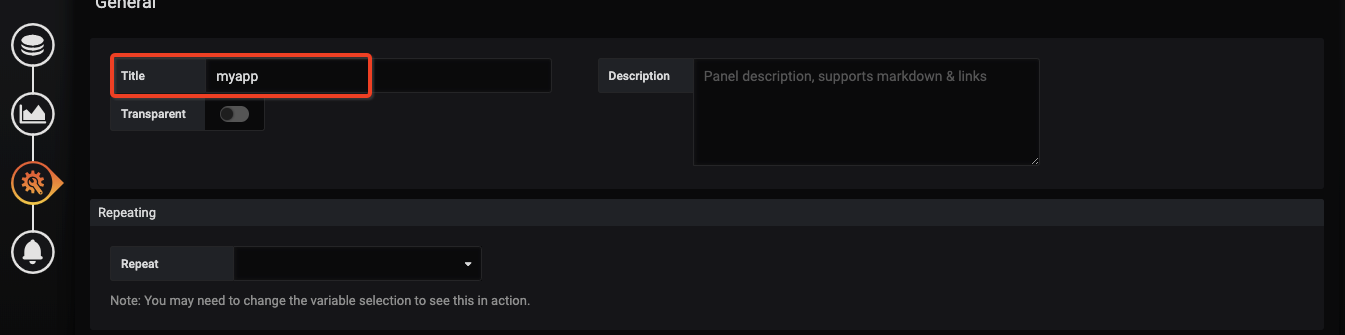
最后保存图表就可以了
演示金丝雀发布
编写v2.0版本的配置清单文件,这里不需要设置service,且副本数量为1,我这里没有修改程序,只是传递了一个环境变量进去表示是2.0版本。
apiVersion: apps/v1
kind: Deployment
metadata:
  name: myapp-deploy-v2.0
  labels:
    appname: myapp
spec:
  replicas: 1
  selector:
    matchLabels:
      appname: myapp
      release: 2.0.0
  template:
    metadata:
      name: myapp
      labels:
        appname: myapp
        release: 2.0.0
      annotations:
        prometheus.io/scrape: "true"
        prometheus.io/port: "5555"
    spec:
      containers:
      - name: myapp
        image: myapp:v1.0
        imagePullPolicy: IfNotPresent
        resources:
          requests:
            cpu: "250m"
            memory: "128Mi"
          limits:
            cpu: "500m"
            memory: "256Mi"
        ports:
        - name: http
          containerPort: 5555
          protocol: TCP
        env:
        - name: VERSION
          value: v2.0.0
        livenessProbe:
          httpGet:
            path: /healthy
            port: http
          initialDelaySeconds: 20
          periodSeconds: 10
          timeoutSeconds: 2
        readinessProbe:
          httpGet:
            path: /healthy
            port: http
          initialDelaySeconds: 20
          periodSeconds: 10
  revisionHistoryLimit: 10
  strategy:
    rollingUpdate:
      maxSurge: 1
      maxUnavailable: 1
    type: RollingUpdate
应用该配置清单文件
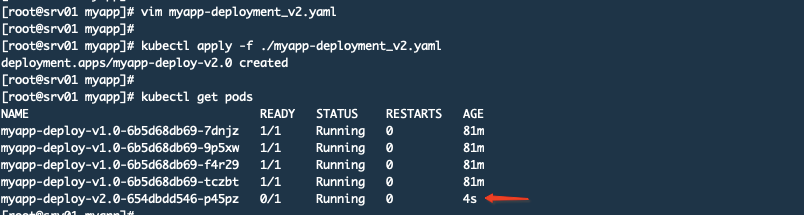
查看监控,黄色表示v2.0.0版本已经有请求了
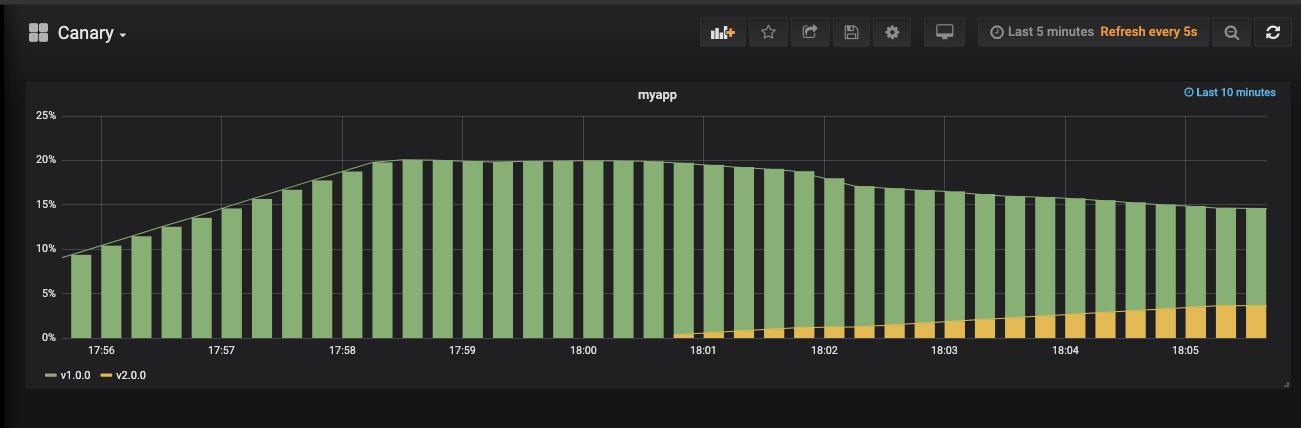
我们V1.0版本有4个副本,V2.0有1个副本,这就意味着30%的流量会进入到v2.0版本上。如果没有问题,我们就会进行扩展V2.0的应用。其实你从图上看流量也只有30%,如下图:
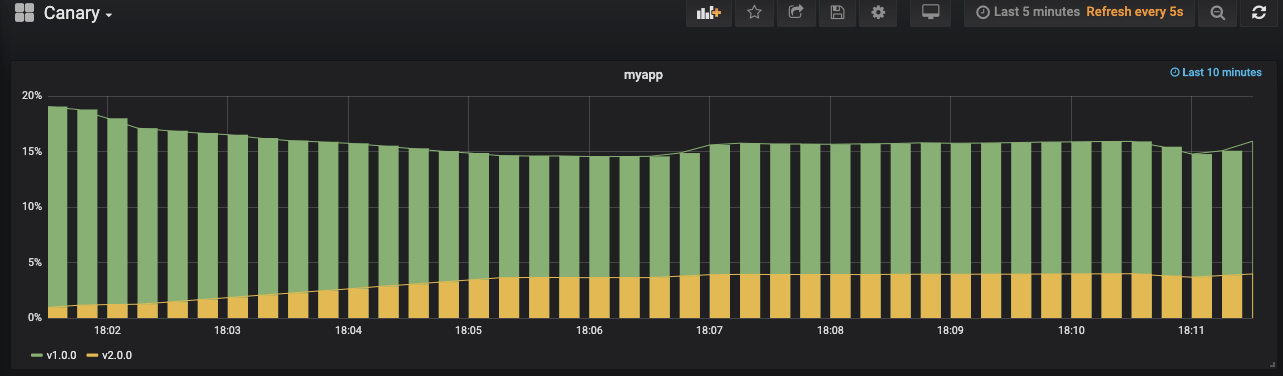
下面进行扩展
kubectl scale --replicas=4 deploy myapp-deploy-v2.0
删除版本V1.0的deployment,注意这里是删除的deployment而并没有删除那个service
kubectl delete deploy myapp-deploy-v1.0
之后你就可以看到V2.0版本已经接管了所有流量

总结
步骤:
4个副本的V1.0应用
部署1个V2.0的应用
观察一段时间确认没有问题
扩展V2.0的应用数量和V1.0一致
扩展完成后,删除V1.0版本应用
这个实验过程参考了一篇文章Kubernetes deployment strategies,它里面还有很多部署方式,大家可以练习。另外我这里之所以选择自己构建镜像而不使用它提供的,是因为我想说明一下如何在Prometheus中监控自己的应用,因为这种需求在工作中会有,即便运维不会遇到,但是运行公司业务的程序也会有这种需求,prometheus提供了Java版本的客户端来让Java使用。其实我现在对Python版本的客户端也不是很了解,只是参考官网简单使用而已。