Create tensorflow structure
	Weights = tf.Variable(......)
	biases = tf.Variable(.....)
	y=......
	# 计算平方并计算均值
	loss = tf.reduce_mean(tf.square(...))
	# 使用梯度下降法进行优化参数
	optimizer = tf.train.GradientDescentOptimizer(0.5)
	train = optimizer.minimize(loss)
	# 激活所有的变量
	init = tf.initialize_all_variables()

	# 从init开始激活
	sess = tf.Session()
	sess.run(init)
for example:

Session
通过with的方法打开session

Variable
	# 定义变量必须通过这种方式
	new_value = tf.Variable(...)
	# 定义常量
	one = tf.constant(1)
Placeholder
	# 首先初始化空位
	input1 = tf.placeholder(tf.float32)
	input2 = tf.placeholder(tf.float32)
	# 定义输出为乘法
	output = tf.mul(input1,input2)
	# 利用with方法进行打开Session
	with tf.Session() as sess:
	# 输入参数为字典类型,运用feed_dict=
	print(sess.run(output,feed_dict={input1:[7.],input2:[2.]}))
Active
添加层
- 定义weight和biases以及方程
Weights = tf.Variable(tf.random_normal([in_size, out_size])) biases = tf.Variable(tf.zeros([1, out_size]) + 0.1) Wx_plus_b = tf.matmul(inputs, Weights) + biases - 定义input的placeholder
# 表示x,和y都是列向量 xs = tf.placeholder(tf.float32, [None, 1]) ys = tf.placeholder(tf.float32, [None, 1]) - 添加层
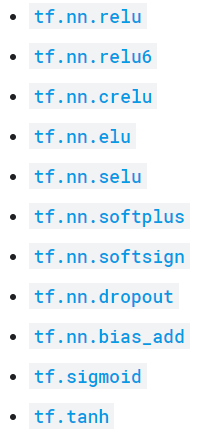
# def add_layer(inputs, in_size, out_size, activation_function=None) # 其中参数为:输入数据,输入数据的个数,输出数据的大小,激活函数 # 添加隐藏层,其中的激活函数使用.nn.relu l1 = add_layer(xs, 1, 10, activation_function=tf.nn.relu) # 添加输出层,其中的 prediction = add_layer(l1, 10, 1, activation_function=None) - 添加loss函数和回归方法
loss = tf.reduce_mean(tf.reduce_sum(tf.square(ys-prediction), reduction_indices=[1])) train_step = tf.train.GradientDescentOptimizer(0.1).minimize(loss) - 进行训练
	# train_step和loss有关,而loss又和prediction有关,所以最后就和x_data和y_data都有关
	sess.run(train_step, feed_dict={xs: x_data, ys: y_data})
	print(sess.run(loss, feed_dict={xs: x_data, ys: y_data}))
Plot
- plot出原来的数据
fig = plt.figure() # 图的长宽和图名 ax = fig.add_subplot(1,1,1) # 以点的方式绘制 ax.scatter(x_data, y_data) # 使用show()会默认将程序暂停,需要使用ion()来忽略暂停 plt.ion() plt.show() - 在现在数据的图上进行不断绘制,进行对比
	# 先进行线的删除,如果没有则pass
	try:
        ax.lines.remove(lines[0])
    except Exception:
        pass
    # 然后将prediction的值绘制出来(因为predition和x_data相关)
    prediction_value = sess.run(prediction, feed_dict={xs: x_data})
    # 使用红色的线进行绘制
    lines = ax.plot(x_data, prediction_value, 'r-', lw=5)
    # 暂停一秒等待绘制
    plt.pause(1)