版权声明:看我干嘛? 你又没打算转载我的博客~ https://blog.csdn.net/wjh2622075127/article/details/87921674
首先从文件导入数据,并进行格式化为numpy矩阵
import numpy as np

def file2array(filename):
    file = open(filename)
    file_lines = file.readlines()
    numberOfLines = len(file_lines)
    dataArray = np.zeros((numberOfLines, 3))
    labels = []
    index = 0
    for line in file_lines:
        line = line.strip() # 参数为空时,默认删除开头、结尾处空白符(包括'\n', '\r',  '\t',  ' ')
        formLine = line.split('\t')
        dataArray[index,:] = formLine[0:3]
        labels.append((formLine[-1]))
        index += 1
    label_id = []
    dic = {}
    index = 1
    for i in range(len(labels)):
        x = dic.get(labels[i], -1)
        label_id.append(x)
        if (label_id[i] == -1):
            label_id[i] = index
            dic[labels[i]] = index
            index += 1
    return dataArray, label_id

data, labels = file2array('datingTestSet.txt')
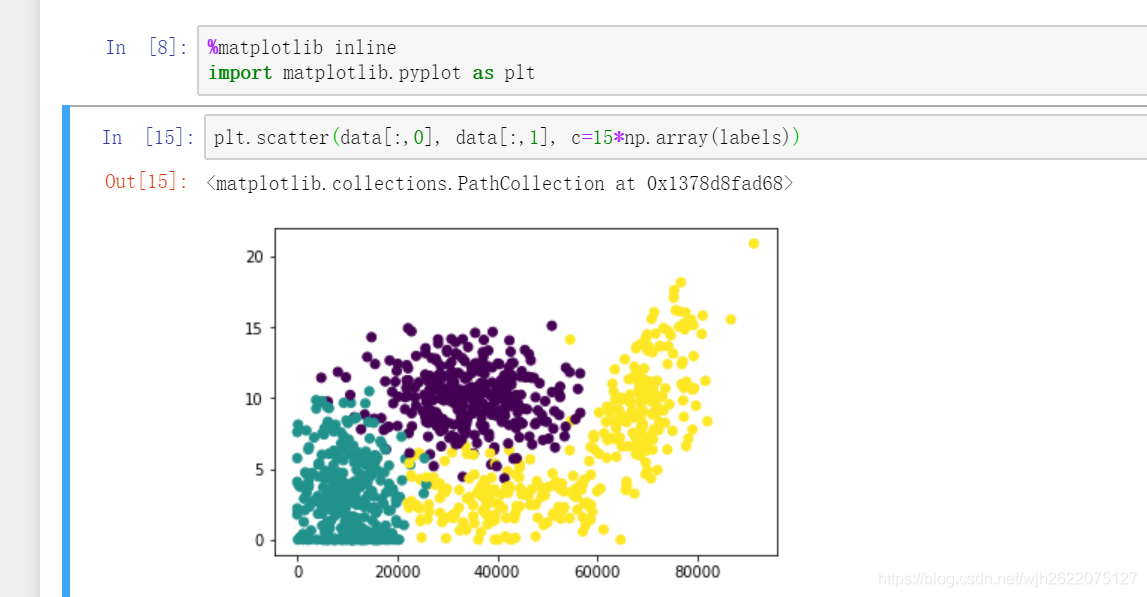
然后开始对数据进行分标签绘图,开始是这样的
%matplotlib inline
import matplotlib.pyplot as plt
plt.scatter(data[:,0], data[:,1], c=15*np.array(labels))
然后给他添加legend
思路是把三种不同标签的图分开,分成三个子图,画在一张图里面
def scatterLegend(data, labels, x, y):
type1 = []
type2 = []
type3 = []
for i in range(len(labels)):
if labels[i] == 1:
type1.append(np.array(data[i]))
elif labels[i] == 2:
type2.append(np.array(data[i]))
else:
type3.append(np.array(data[i]))
type1 = np.array(type1)
type2 = np.array(type2)
type3 = np.array(type3)
g1 = plt.scatter(type1[:, x], type1[:, y], c='red')
g2 = plt.scatter(type2[:, x], type2[:, y], c='yellow')
g3 = plt.scatter(type3[:, x], type3[:, y], c='blue')
plt.legend(handles=[g1, g2, g3], labels=['not at all', 'a small doses', 'a large doses'])
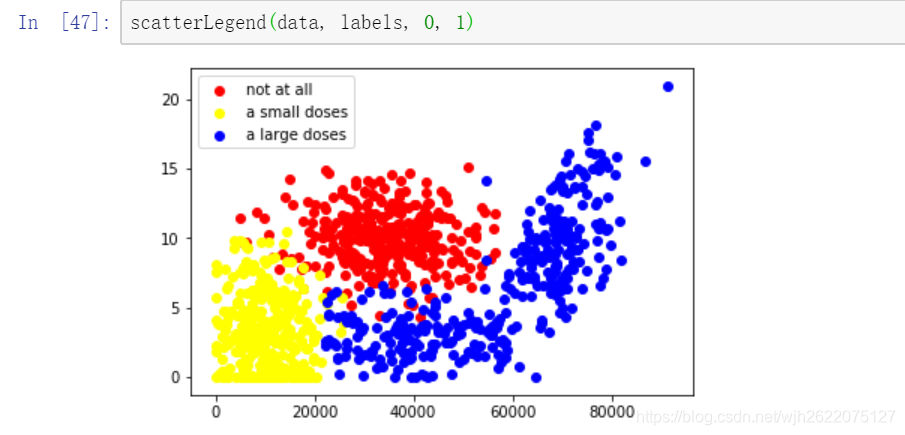
scatterLegend(data, labels, 0, 1)
结果变成了这样