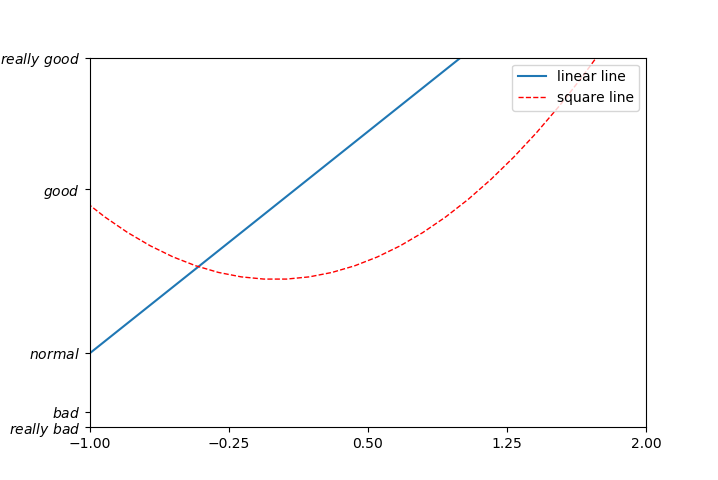
1、添加图例
>>> import matplotlib.pyplot as plt
>>> import numpy as np
>>> x = np.linspace(-3, 3, 50)
>>> y1 = 2*x + 1
>>> y2 = x**2
>>> plt.figure()
<Figure size 640x480 with 0 Axes>
>>> plt.xlim((-1, 2))
(-1, 2)
>>> plt.ylim((-2, 3))
(-2, 3)
>>> new_sticks = np.linspace(-1, 2, 5)
>>> plt.xticks(new_sticks)
([<matplotlib.axis.XTick object at 0x000001C38FA6F198>, <matplotlib.axis.XTick object at 0x000001C38F57F748>, <matplotlib.axis.XTick object at 0x000001C38F57F0F0>, <matplotlib.axis.XTick object at 0x000001C38F516D30>, <matplotlib.axis.XTick object at 0x000001C38F59D908>], <a list of 5 Text xticklabel objects>)
>>> plt.yticks([-2, -1.8, -1, 1.22, 3],
...            [r'$really\ bad$', r'$bad$', r'$normal$', r'$good$', r'$really\ good$'])
([<matplotlib.axis.YTick object at 0x000001C38F50E668>, <matplotlib.axis.YTick object at 0x000001C38F2DD828>, <matplotlib.axis.YTick object at 0x000001C38F57FBE0>, <matplotlib.axis.YTick object at 0x000001C38F59D6A0>, <matplotlib.axis.YTick object at 0x000001C38F59D438>], <a list of 5 Text yticklabel objects>)
>>> l1, = plt.plot(x, y1, label='linear line')
>>> l2, = plt.plot(x, y2, color='red', linewidth=1.0, linestyle='--', label='square line')
#legend将要显示的信息来自于上面代码中的 label. 所以我们只需要简单写下一下代码, plt 就能自动的为我们添加图例
#参数 loc='upper right' 表示图例将添加在图中的右上角.
>>> plt.legend(loc='upper right')
<matplotlib.legend.Legend object at 0x000001C38B7D8780>
>>> plt.show()
2、调整位置和名称
如果我们想单独修改之前的 label 信息, 给不同类型的线条设置图例信息. 我们可以在 plt.legend 输入更多参数. 如果以下面这种形式添加 legend, 我们需要确保, 在上面的代码 plt.plot(x, y2, label='linear line') 和 plt.plot(x, y1, label='square line') 中有用变量 l1 和 l2 分别存储起来. 而且需要注意的是 l1, l2,要以逗号结尾, 因为plt.plot() 返回的是一个列表.
>>> plt.legend(handles=[l1, l2], labels=['up', 'down'],  loc='best')
<matplotlib.legend.Legend object at 0x000001C38FA44630>
>>> plt.show()
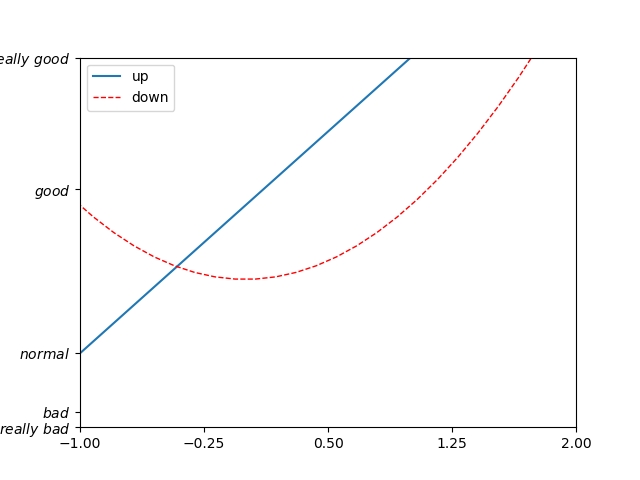
其中’loc’参数有多种,’best’表示自动分配最佳位置,其余的如下:
 'best' : 0,
 'upper right'  : 1,
 'upper left'   : 2,
 'lower left'   : 3,
 'lower right'  : 4,
 'right'        : 5,
 'center left'  : 6,
 'center right' : 7,
 'lower center' : 8,
 'upper center' : 9,
 'center'       : 10,