maven引入配置
<dependency>
    <groupId>jfree</groupId>
    <artifactId>jfreechart</artifactId>
    <version>1.0.13</version>
</dependency>
<dependency>
    <groupId>org.jfree</groupId>
    <artifactId>jcommon</artifactId>
    <version>1.0.24</version>
</dependency>
<dependency>
    <groupId>incanter</groupId>
    <artifactId>gnujaxp</artifactId>
    <version>1</version>
</dependency>
工具类
import java.awt.*;
import java.io.File;
import java.io.IOException;
import org.jfree.chart.ChartFactory;
import org.jfree.chart.ChartUtilities;
import org.jfree.chart.JFreeChart;
import org.jfree.chart.plot.PlotOrientation;
import org.jfree.data.category.DefaultCategoryDataset;
import org.jfree.data.general.DefaultPieDataset;
public class JFreeChartUtil {
public static boolean drawBarChart(JFreeChartConfig config, DefaultCategoryDataset dataset,
String outputFile) {
JFreeChart barChart = ChartFactory.createBarChart(config.getTitle(),
config.getCategoryAxisLabel(), config.getValueAxisLabel(), dataset,
PlotOrientation.VERTICAL, true, true, false);
barChart.getPlot().setBackgroundPaint(SystemColor.WHITE);
try {
ChartUtilities.saveChartAsJPEG(new File(outputFile), barChart, config.getWidth(),
config.getHeight());
return true;
} catch (IOException e) {
return false;
}
}
public static boolean drawLineChart(JFreeChartConfig config, DefaultCategoryDataset dataset,
String outputFile) {
JFreeChart lineChartObject = ChartFactory.createLineChart(config.getTitle(),
config.getCategoryAxisLabel(), config.getValueAxisLabel(), dataset,
PlotOrientation.VERTICAL, true, true, false);
lineChartObject.getPlot().setBackgroundPaint(SystemColor.WHITE);
File lineChart = new File(outputFile);
try {
ChartUtilities.saveChartAsJPEG(lineChart, lineChartObject, config.getWidth(),
config.getHeight());
return true;
} catch (IOException e) {
return false;
}
}
public static boolean drawPieChart(JFreeChartConfig config, DefaultPieDataset dataset,
String outputFile) {
JFreeChart pieChar = ChartFactory.createPieChart(config.getTitle(), dataset, true, true,
false);
pieChar.getPlot().setBackgroundPaint(SystemColor.WHITE);
File pieChart = new File(outputFile);
try {
ChartUtilities.saveChartAsJPEG(pieChart, pieChar, config.getWidth(),
config.getHeight());
return true;
} catch (IOException e) {
return false;
}
}
public static void main(String[] args) {
final String price = "price";
final String number = "number";
final String type = "type";
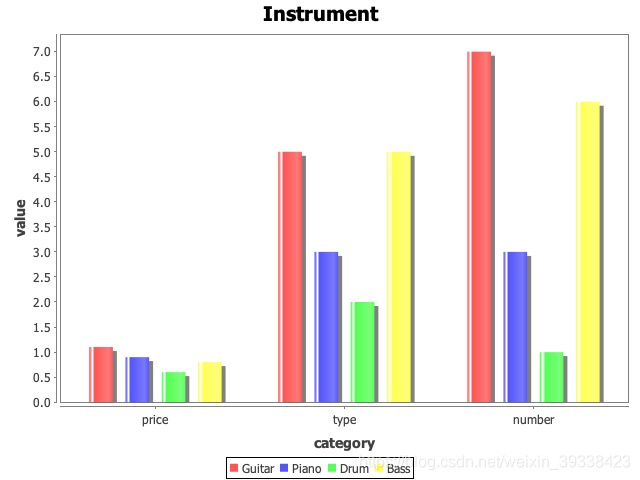
DefaultCategoryDataset dataset = new DefaultCategoryDataset();
dataset.addValue(1.1, "Guitar", price);
dataset.addValue(5, "Guitar", type);
dataset.addValue(7, "Guitar", number);
dataset.addValue(0.9, "Piano", price);
dataset.addValue(3, "Piano", type);
dataset.addValue(3, "Piano", number);
dataset.addValue(0.6, "Drum", price);
dataset.addValue(2, "Drum", type);
dataset.addValue(1, "Drum", number);
dataset.addValue(0.8, "Bass", price);
dataset.addValue(5, "Bass", type);
dataset.addValue(6, "Bass", number);
JFreeChartConfig config = new JFreeChartConfig();
config.setTitle("Instrument");
config.setCategoryAxisLabel("category");
config.setValueAxisLabel("value");
config.setWidth(640);
config.setHeight(480);
String barChartFile = "/Users/wangzhongxing/Downloads/barChart.jpeg";
boolean barChartResult = drawBarChart(config, dataset, barChartFile);
System.out.println(barChartResult);
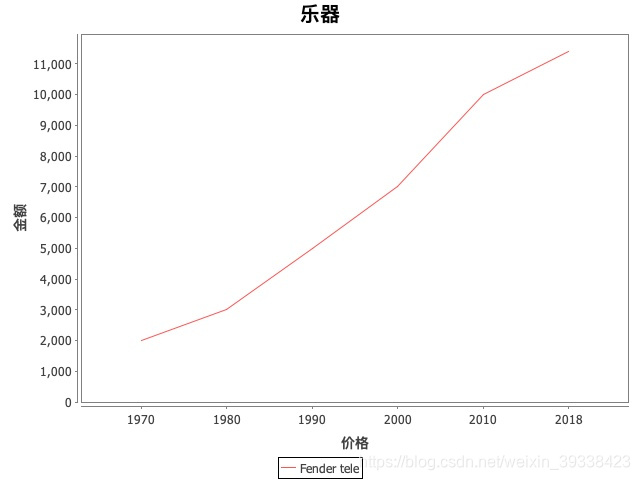
DefaultCategoryDataset lineChartDataset = new DefaultCategoryDataset( );
lineChartDataset.addValue( 2000, "Fender tele" , "1970" );
lineChartDataset.addValue( 3000, "Fender tele" , "1980" );
lineChartDataset.addValue( 5000 , "Fender tele" , "1990" );
lineChartDataset.addValue( 7000, "Fender tele" , "2000" );
lineChartDataset.addValue( 10000, "Fender tele" , "2010" );
lineChartDataset.addValue( 11400, "Fender tele" , "2018" );
JFreeChartConfig lineConfig = new JFreeChartConfig();
lineConfig.setTitle("乐器");
lineConfig.setCategoryAxisLabel("价格");
lineConfig.setValueAxisLabel("金额");
lineConfig.setWidth(640);
lineConfig.setHeight(480);
String lineChartFile = "/Users/wangzhongxing/Downloads/lineChart.png";
boolean lineChartResult = drawLineChart(lineConfig, lineChartDataset, lineChartFile);
System.out.println(lineChartResult);
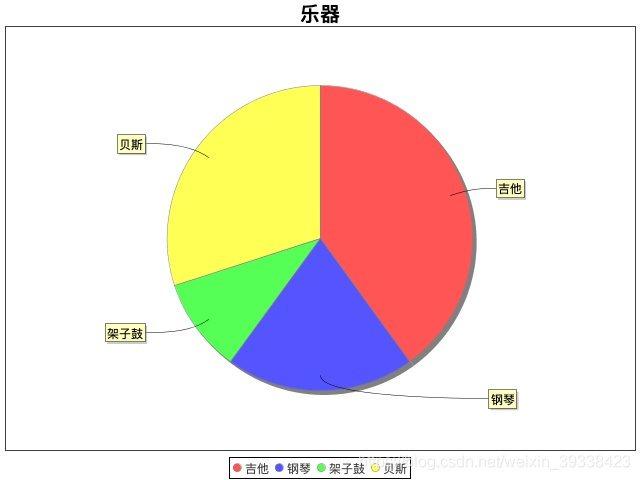
JFreeChartConfig pieConfig = new JFreeChartConfig();
pieConfig.setTitle("乐器");
pieConfig.setCategoryAxisLabel("种类");
pieConfig.setValueAxisLabel("数量");
pieConfig.setWidth(640);
pieConfig.setHeight(480);
DefaultPieDataset pieDataset = new DefaultPieDataset();
pieDataset.setValue("吉他", 40);
pieDataset.setValue("钢琴", 20);
pieDataset.setValue("架子鼓", 10);
pieDataset.setValue("贝斯", 30);
String pieChartFile = "/Users/wangzhongxing/Downloads/pieChart.png";
boolean pieChartResult = drawPieChart(pieConfig, pieDataset, pieChartFile);
System.out.println(pieChartResult);
}
}
依赖模型
public class JFreeChartConfig {
private String title;
private String categoryAxisLabel;
private String valueAxisLabel;
private int width;
private int height;
public String getTitle() {
return title;
}
public void setTitle(String title) {
this.title = title;
}
public String getCategoryAxisLabel() {
return categoryAxisLabel;
}
public void setCategoryAxisLabel(String categoryAxisLabel) {
this.categoryAxisLabel = categoryAxisLabel;
}
public String getValueAxisLabel() {
return valueAxisLabel;
}
public void setValueAxisLabel(String valueAxisLabel) {
this.valueAxisLabel = valueAxisLabel;
}
public int getWidth() {
return width;
}
public void setWidth(int width) {
this.width = width;
}
public int getHeight() {
return height;
}
public void setHeight(int height) {
this.height = height;
}
}
生成图片样例
柱状图
折线图
饼图