公司现在的项目中有学生答题的模块,其中数据统计的部分需要以图表的形式绘制出来,更加直观的展示。项目中用到的前端图表库是Highcharts,这里记录一下绘制过程。项目中用到是最简单的曲线图,所以这里就以曲线图的绘制为例。
Controller层的代码非常简单,包含一个jsp跳转方法和生成示例数据的方法:
package com.csdn.myboot.controller;

import com.csdn.myboot.service.HighchartsService;
import org.springframework.beans.factory.annotation.Autowired;
import org.springframework.stereotype.Controller;
import org.springframework.web.bind.annotation.*;
import org.springframework.web.servlet.ModelAndView;

import java.util.Map;

/**
 * @author haozz
 * @date 2018/7/12 16:11
 * @description
 */
@Controller
@RequestMapping(value="/highcharts")
public class HighchartsCtrl {

    @Autowired
    private HighchartsService highchartsService;

    @GetMapping(value = "/index")
    public ModelAndView toIndex(){
        ModelAndView mv = new ModelAndView("highcharts/highcharts_demo");
        return mv;
    }

    @GetMapping(value = "/demodata/{type}")
    @ResponseBody
    public Map<String,Object> demodata(@PathVariable("type") String type) {
        return highchartsService.demodata(type);
    }
}
Service层主要是用来生成示例数据。我们首先要明确的是在Highcharts中绘制图表时使用的最终数据大多是Map格式:
package com.csdn.myboot.service;

import org.springframework.stereotype.Service;

import java.util.*;

/**
 * @author haozz
 * @date 2018/7/12 17:12
 * @description
 */
@Service
public class HighchartsService {
    public Map<String,Object> demodata(String type){
        Map<String,Object> result = new HashMap<>();
        if(type.equals("summary1")){
            Set<String> date = new HashSet<>();
            date.add("2018-01-01");date.add("2018-01-02");date.add("2018-01-03");date.add("2018-01-04");date.add("2018-01-05");
            date.add("2018-01-06");date.add("2018-01-07");date.add("2018-01-08");date.add("2018-01-09");date.add("2018-01-10");
            result.put("keys",date);

            List<Integer> values1 = new ArrayList<>();
            values1.add(2);values1.add(4);values1.add(5);values1.add(7);values1.add(11);
            values1.add(13);values1.add(9);values1.add(6);values1.add(8);values1.add(10);
            result.put("values1",values1);

            List<Integer> values2 = new ArrayList<>();
            values2.add(10);values2.add(8);values2.add(6);values2.add(9);values2.add(13);
            values2.add(11);values2.add(7);values2.add(5);values2.add(4);values2.add(2);
            result.put("values2",values2);
        }else if(type.equals("summary2")){
            //没有数据
            Set<String> date = new HashSet<>();
            result.put("keys",date);
            List<Integer> values = new ArrayList<>();
            result.put("values",values);
        }else if(type.equals("summary3")){

        }else if(type.equals("summary4")){

        }
        return result;
    }
}
jsp中需要引入jQuery,以及Highcharts的相关js。其中highcharts.js是其基本库,highcharts-zh_CN.js是中文库,highcharts-nodata.js用于无数据时的绘制效果:
<%@ page contentType="text/html;charset=UTF-8" language="java" %>
<html>
<head>
    <title>Highcharts-Summary</title>
    <script src="../../js/jquery.min.js"></script>
    <script src="../../js/layui/layui.js"></script>
    <script src="../../js/highcharts/highcharts.js"></script>
    <script src="../../js/highcharts/highcharts-zh_CN.js"></script>
    <script src="../../js/highcharts/highcharts-nodata.js"></script>
    <script src="../../js/highcharts_demo/highcharts_demo.js"></script>
    <style>
        .title{font-size: 25px;margin-right: 50px;color:#666;}
        .option{cursor: pointer;margin-right: -9px!important;border:1px solid #d6dadd;padding:0 15px;height:32px;text-align:center;line-height:32px;display:inline-block;background:#eee;color: #9f9f9f;}
    </style>
</head>
<body>
<div>
    <div id="summary_status">
        <span class="title">统计情况</span>
        <span class="option selected" style="border-radius: 3px 0 0 3px; color:#00a2d4;" onclick="HighchartsSummary.reload('summary1')">统计1</span>
        <span class="option" onclick="HighchartsSummary.reload('summary2')">统计2</span>
        <span class="option" onclick="HighchartsSummary.reload('summary3')">统计3</span>
        <span class="option" style="border-radius: 0 3px 3px 0;" onclick="HighchartsSummary.reload('summary4')">统计4</span>
    </div>
    <div id="HighchartsSummaryImage"></div>
</div>
</body>
<script type="text/javascript">
    (function(){
        var $options= $("#summary_status").find(".option");
        $options.click(function(){
            $options.removeClass("selected");
            $(this).addClass("selected");
            $options.css('color','#9f9f9f');
            $(this).css('color','#00a2d4');
        });
    })();
</script>
</html>
再来看最终的highcharts_demo.js:
$(function(){
    window.HighchartsSummary= (function(){
        var reportTitle={
            "summary1":{
                "subject":"统计趋势1",
                "y":"人数",
                "yunit":"人",
                "xtitle":"统计趋势1-人数"
            },
            "summary2":{
                "subject":"统计趋势2",
                "y":"时长",
                "yunit":"分钟",
                "xtitle":"统计趋势2-时长"
            },
            "summary3":{
                "subject":"统计趋势3",
                "y":"数量",
                "yunit":"个",
                "xtitle":"统计趋势3-个"
            },
            "summary4":{
                "subject":"统计趋势4",
                "y":"数量",
                "yunit":"个",
                "xtitle":"统计趋势4-个"
            }
        };
        function initHighchartsSummary(type) {
            $.ajax({
                url : "/highcharts/demodata/"+type,
                type : 'get',
                cache : false,
                dataType : 'json',
                success : function(res) {
                    if(res.keys == ''){
                        initNullImage(reportTitle[type]);
                    }else{
                        initImage(res,reportTitle[type]);
                    }
                },
                error : function() {
                    console.log("获取数据异常。")
                }
            });
        }

        function initNullImage(title){
            $('#HighchartsSummaryImage').highcharts({
                title: {text: title.subject},
                yAxis:{title:{text: '日期'}},
                series: [{name: title.xtitle}],
                lang: {noData: "暂无数据"}
            });
        }

        function initImage(data,title){
            var keys= data.keys;
            var values1= data.values1;
            var values2= data.values2;
            $("#HighchartsSummaryImage").highcharts({
                chart:{
                    type: 'bar',//type表示图象类型,默认为line-折线,spline表示曲线,bar为柱状
                },
                title:{
                    text:title.subject//图表头部title值
                },
                xAxis:{//x轴
                    title:{
                        text:'日期',
                    },
                    categories:keys,
                    labels:{
                        format: '{value}'
                    }
                },
                yAxis:{//y轴
                    title:{
                        text: title.y
                    },
                    allowDecimals:false,
                    labels:{
                        format: '{value}'+title.yunit
                    }
                },
                tooltip:{
                    crosshairs:true,
                    shared:true
                },
                series:[{
                    name:title.xtitle,
                    marker:{
                        symbol:'square'
                    },
                    data:values1
                },
                    {
                        name:title.xtitle,
                        marker:{
                            symbol:'square'
                        },
                        data:values2
                    }
                ]

            });
        }

        initHighchartsSummary('summary1');

        var reload= function(type){
            initHighchartsSummary(type);
        };

        return {
            reload: reload
        }
    })();
});请求Controller,返回Map格式的数据,其中包含横纵坐标的数据。initNullImage方法用于渲染无数据时的视图。initImage方法用于绘制Highcharts图表,因为是示例数据,所有只用到了最简单的一些属性,其中chart下的type值表示图形样式,默认为line表示折线,可选值有spline-曲线,bar-柱状等,大家可以自己试一下效果。Highcharts还可以绘制柱状图、饼图等等,功能非常强大,具体内容可以查看Highcharts的API:https://api.hcharts.cn/highcharts。大家可以到Highcharts官网拜一下码头:https://www.hcharts.cn/demo/highcharts。
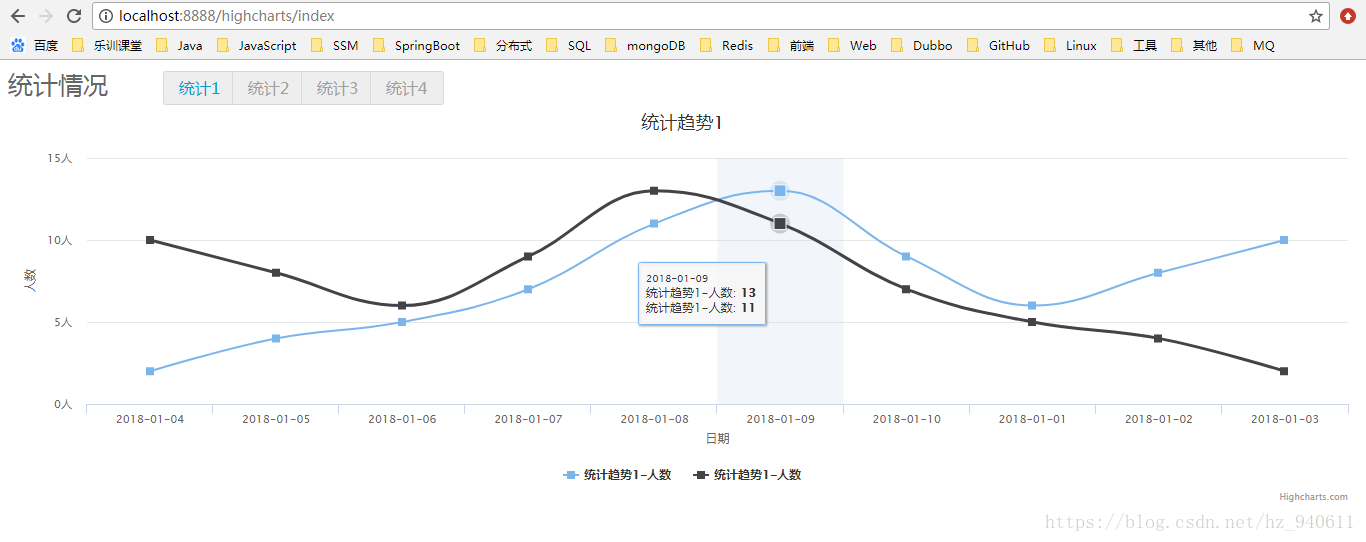
最终效果:
line:

spline:
bar:

无数据:
