项目中需要监控系统指标(JVM,CPU,IO,MySQL等),这时候可以使用Prometheus来做。如果是需要监控日志系统,可以使用ELK stack。监控=日志(ELK)+指标(Prometheus)。
step1 编写springboot2程序
<dependency>
            <groupId>org.springframework.boot</groupId>
            <artifactId>spring-boot-starter-actuator</artifactId>
        </dependency>
<dependency>
            <groupId>io.micrometer</groupId>
            <artifactId>micrometer-registry-prometheus</artifactId>
</dependency>
step2 node_exporter安装:
在https://github.com/prometheus/node_exporter/releases找到最新的压缩包,然后wget,解压tar -zxvf到本地。
执行:./mysqld_exporter
step3 mysql_exporter安装
在https://github.com/prometheus/mysqld_exporter找到最新的压缩包,然后wget,解压tar -zxvf到本地。
详细安装参考官方文档。
1 mysql创建新用户:
CREATE USER 'exporter'@'localhost' IDENTIFIED BY 'XXXXXXXX' WITH MAX_USER_CONNECTIONS 3;
GRANT PROCESS, REPLICATION CLIENT, SELECT ON . TO 'exporter'@'localhost';
2设置环境变量:
export DATA_SOURCE_NAME='user:password@(hostname:3306)/'
3 启动
./mysqld_exporter
先确保mysql启动和有my.cnf文件,然后执行:./mysqld_exporter
step4 prometheus安装和配置
下载最新版的prometheus安装和配置:wget https://github.com/prometheus/prometheus/releases/download/v2.8.0-rc.0/prometheus-2.8.0-rc.0.darwin-amd64.tar.gz
解压到本地:
先配置prometheus.yml文件,需要定义一系列job和targets以连接到step1-3中的组件。
prometheus.yml 参考:
# my global config
global:
  scrape_interval:     15s # Set the scrape interval to every 15 seconds. Default is every 1 minute.
  evaluation_interval: 15s # Evaluate rules every 15 seconds. The default is every 1 minute.
  # scrape_timeout is set to the global default (10s).

# Alertmanager configuration
alerting:
  alertmanagers:
    - static_configs:
        - targets:
          # - alertmanager:9093

# Load rules once and periodically evaluate them according to the global 'evaluation_interval'.
rule_files:
# - "first_rules.yml"
# - "second_rules.yml"

# A scrape configuration containing exactly one endpoint to scrape:
# Here it's Prometheus itself.
scrape_configs:
  # The job name is added as a label `job=<job_name>` to any timeseries scraped from this config.
  - job_name: 'prometheus'
    # metrics_path defaults to '/metrics'
    # scheme defaults to 'http'.
    static_configs:
      - targets: ['localhost:9090']
  - job_name: 'node'
    static_configs:
      - targets: ['localhost:9100']

  - job_name: 'spring-boot'
    metrics_path: /prometheus
    static_configs:
      - targets: ['localhost:8080']

  - job_name: 'mysql-monitor'
    static_configs:
      - targets: ['localhost:9104']
编写好之后启动prometheus
./prometheus --config.file=prometheus.yml
访问localhost:9090,查看targets看配置的监控是否正确: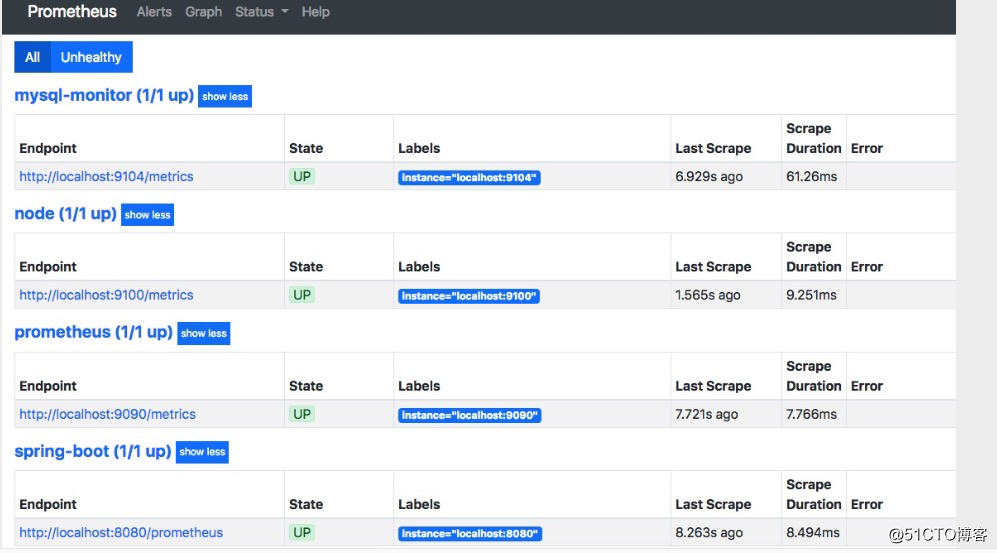
step5 grafana安装
wget https://dl.grafana.com/oss/release/grafana-6.0.1.darwin-amd64.tar.gz,
tar -zxvf grafana-6.0.1.darwin-amd64.tar.gz
./bin/grafana-server web
step6 自定义panel:jvm,mysql,cpu相关指数