前言
本文基于设计开发一个应用功能监控项目的需求,其能在不入侵系统的情况下正常监控应用功能。调研之后选择了prometheus+grafana+springboot2的方案。本文基于此简单讲述一下这几个系统之间的配置、交互和使用。并从prometheus的功能,配置,使用,以及与dashboard和springboot/springcloud的集成等方面简单分析,对于各单独系统的安装不在本文讲述范围之内。
一、prometheus
1.简介
Prometheus,是一个开源的系统监控和告警的工具包,其采用Pull方式采集时间序列的度量数据(也支持push方式),通过Http协议传输。它的工作方式是被监控的服务需要公开一个Prometheus端点,这端点是一个HTTP接口,该接口公开了度量的列表和当前的值,然后Prometheus应用从此接口定时拉取数据,一般可以存放在时序数据库中,然后通过可视化的Dashboard(e.g.Grafana)进行数据展示。
2.支持的prometheus metrics
Counter,Gauge,Histogram,Summary,不进行细节介绍了,后面会专门写prometheus的文章。需要注意的是counter只能增不能减,适用于服务请求量,用户访问数等统计,但是如果需要统计有增有减的指标需要用Gauge。
3.支持的exporter很多,可以方便的监控很多应用,同时也可以自定义开发非官方提供的exporter。
二、grafana
1.简介
grafana,是一个开源的dashboard展示工具,可以支持很多主流数据源,包括时序性的和非时序性的。其提供的展示配置以及可扩展性能满足绝大部分时间序列数据展示需求,是一个比较优秀的工具。
2.支持的数据源
prometheus,inflexdb,elasticsearch,mysql,postgreSQL,openTSDB等,更多数据源
三、springboot2与prometheus的集成
1.springboot集成配置
springboot2.x与prometheus的集成与springboot1.x区别比较大。prometheus官方提供的Java client不能支持2.x的处理。很多其中调用的class都找不到了。所以在2.x中 simpleclient_spring_boot就不起作用了,启动会报错。幸好开源工具包io.micrometer提供了2.x中对prometheus采集端点的支持。所以在依赖中添加以下配置(使用gradle作为编译工具):
compile group: 'io.micrometer', name: 'micrometer-registry-prometheus', version: '1.0.6'另外springboot2.x中提供了actuator作为采集exporter,为prometheus暴露采集端点,只需要在项目依赖中添加以下配置即可:
compile('org.springframework.boot:spring-boot-starter-actuator')完成之后就可以在springboot项目中自定义采集样本和方式了。
同时在配置文件application.yaml中要增加如下配置
management:
    security:
# 仅限于 开发环境可对security进行关闭。
        enabled: false
    metrics:
        export:
            prometheus:
                enabled: true
                step: 1m
                descriptions: true
    web:
        server:
            auto-time-requests: true
    endpoints:
        prometheus:
            id: springmetrics
        web:
            exposure:
                include:         health,info,env,prometheus,metrics,httptrace,threaddump,heapdump,springmetrics
配置完成之后即可在启动应用之后通过host:port/actuator/prometheus 访问采集信息
之后在prometheus的配置文件prometheus.yml中添加scrape_configs:
- job_name: 'demo'
    metrics_path: /actuator/prometheus
    static_configs:
    - targets: ['localhost:9009']
即可与prometheus建立联系。之后就可以在grafana中配置prometheus的数据源进行监控展示。
2.集成框架
micrometer提供了基于Java的monitor facade,其与springboot应用和prometheus的集成方式如下图展示
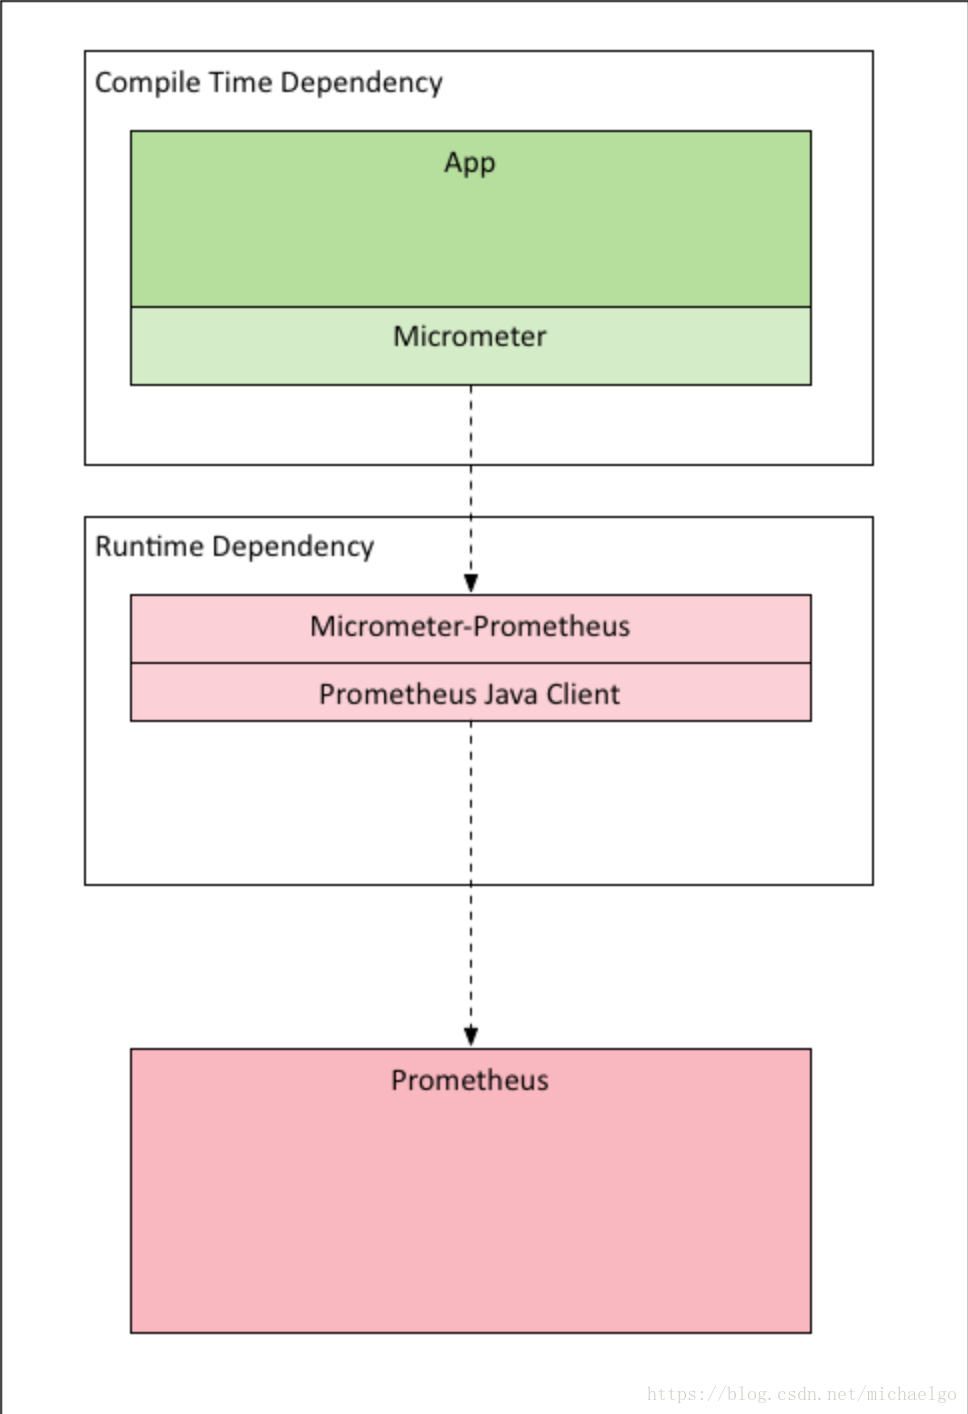
上图中展示的很清楚,应用通过micrometer采集和暴露监控端点给prometheus,prometheus通过pull模式来采集监控时序数据信息。之后作为数据源提供给grafana进行展示。
3.micrometer支持的度量方式及在springboot中的应用示例
- Counter
Counter(计数器)简单理解就是一种只增不减的计数器。它通常用于记录服务的请求数量、完成的任务数量、错误的发生数量等等。
@Service("collectorService")
public class CollectorService {

    static final Counter userCounter = Metrics.
            counter("user.counter.total", "services", "demo");

    public void processCollectResult() throws InterruptedException {

        while (true){

             userCounter.increment(1D);

        }

    }
}- Gauge
Gauge(仪表)是一个表示单个数值的度量,它可以表示任意地上下移动的数值测量。Gauge通常用于变动的测量值,如当前的内存使用情况,同时也可以测量上下移动的"计数",比如队列中的消息数量
@Component("passCaseMetric")
public class PassCaseMetric {

    List<Tag> init(){
        ArrayList<Tag> list = new ArrayList(){};
        list.add(new ImmutableTag("service", "demo"));
        return list;
    }

    AtomicInteger atomicInteger = new AtomicInteger(0);

    Gauge passCaseGuage = Gauge.builder("pass.cases.guage", atomicInteger, AtomicInteger::get)
            .tag("service", "demo")
            .description("pass cases guage of demo")
            .register(new SimpleMeterRegistry());


    AtomicInteger passCases =  Metrics.gauge("pass.cases.guage.value", init(), atomicInteger);

    public void handleMetrics() {

        while (true){
            if (System.currentTimeMillis() % 2 == 0){
                passCases.addAndGet(100);
                System.out.println("ADD + " + passCaseGuage.measure() + " : " + passCases);
            }else {
                int val = passCases.addAndGet(-100);
                if (val < 0){
                    passCases.set(1);
                }
                System.out.println("DECR - " + passCaseGuage.measure() + " : " + passCases);
            }
        }

    }
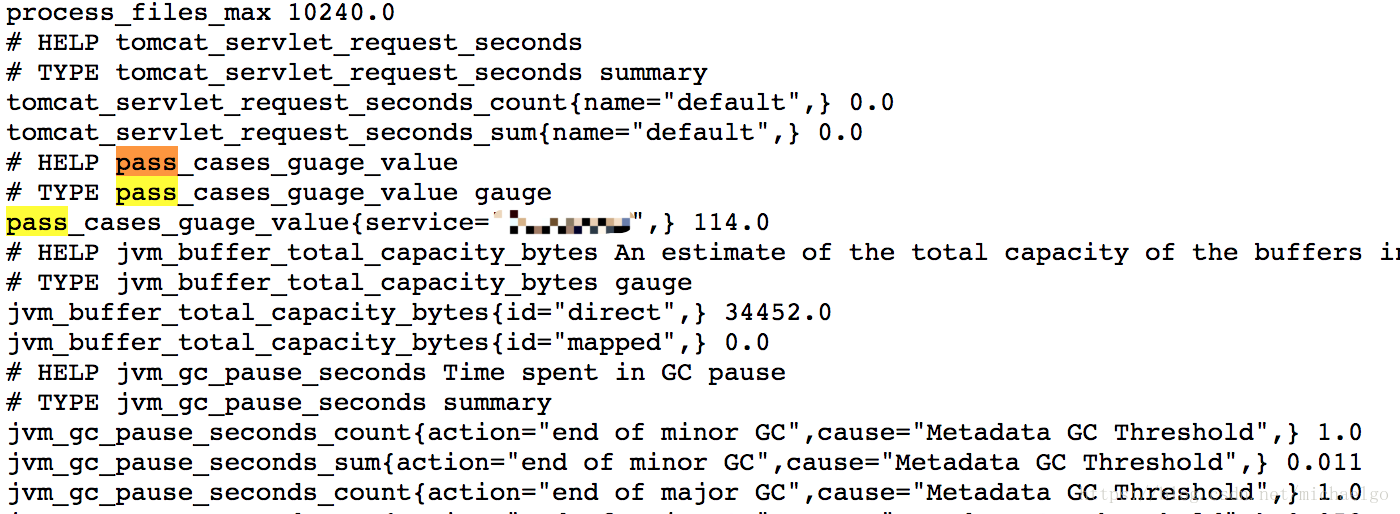
}启动springboot应用,可以在http://host:port/actuator/prometheus 看到端点收集到的数据。其他的也是类似的不再一一截图展示。
这里使用了一个true的循环用来展示不断更新的效果。
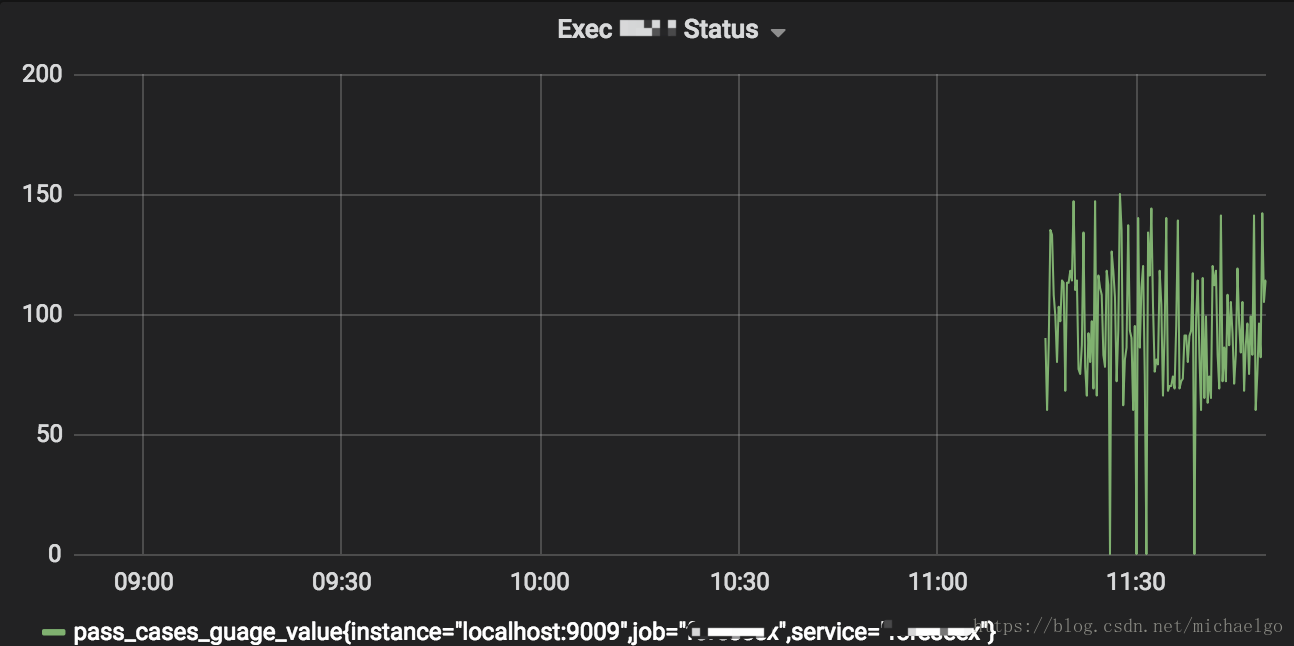
同样的可以在grafana中看到监控展示信息
- Timer
Timer(计时器)同时测量一个特定的代码逻辑块的调用(执行)速度和它的时间分布。简单来说,就是在调用结束的时间点记录整个调用块执行的总时间,适用于测量短时间执行的事件的耗时分布,例如消息队列消息的消费速率。
    @Test
    public void testTimerSample(){
        Timer timer = Timer.builder("timer")
                .tag("timer", "timersample")
                .description("timer sample test.")
                .register(new SimpleMeterRegistry());

        for(int i=0; i<2; i++) {
            timer.record(() -> {
                try {
                    TimeUnit.SECONDS.sleep(2);
                }catch (InterruptedException e){

                }

            });
        }

        System.out.println(timer.count());
        System.out.println(timer.measure());
        System.out.println(timer.totalTime(TimeUnit.SECONDS));
        System.out.println(timer.mean(TimeUnit.SECONDS));
        System.out.println(timer.max(TimeUnit.SECONDS));
    }
响应数据
2
[Measurement{statistic='COUNT', value=2.0}, Measurement{statistic='TOTAL_TIME', value=4.005095763}, Measurement{statistic='MAX', value=2.004500494}]
4.005095763
2.0025478815
2.004500494- Summary
Summary(摘要)用于跟踪事件的分布。它类似于一个计时器,但更一般的情况是,它的大小并不一定是一段时间的测量值。在micrometer中,对应的类是DistributionSummary,它的用法有点像Timer,但是记录的值是需要直接指定,而不是通过测量一个任务的执行时间。
    @Test
    public void testSummary(){

        DistributionSummary summary = DistributionSummary.builder("summary")
                .tag("summary", "summarySample")
                .description("summary sample test")
                .register(new SimpleMeterRegistry());

        summary.record(2D);
        summary.record(3D);
        summary.record(4D);

        System.out.println(summary.count());
        System.out.println(summary.measure());
        System.out.println(summary.max());
        System.out.println(summary.mean());
        System.out.println(summary.totalAmount());
    }
响应数据:
3
[Measurement{statistic='COUNT', value=3.0}, Measurement{statistic='TOTAL', value=9.0}, Measurement{statistic='MAX', value=4.0}]
4.0
3.0
9.0
后记
本文从prometheus、grafana与springboot2.x的集成,配置和应用开发使用方面进行了介绍。对于细节方面以及使用中遇到的一些问题,我会再开文章继续补充。文中部分内容有参考其他博文以及官方文档,如有不妥请及时指出。共同学习。
refer links:
https://github.com/micrometer-metrics/micrometer
http://www.cnblogs.com/throwable/p/9346547.html
https://www.javacodegeeks.com/2017/11/using-micrometer-spring-boot-2.html