import numpy as np
import matplotlib.pyplot as plt
def loadDataSet(fileName): #general function to parse tab -delimited floats
numFeat = len(open(fileName).readline().split('\t')) - 1 #get number of fields
dataMat = []; labelMat = []
fr = open(fileName)
for line in fr.readlines():
lineArr =[]
curLine = line.strip().split('\t')
for i in range(numFeat):
lineArr.append(float(curLine[i]))
dataMat.append(lineArr)
labelMat.append(float(curLine[-1]))
return dataMat,labelMat
def standRegres(xArr,yArr):
xMat = np.mat(xArr); yMat = np.mat(yArr).T
xTx = xMat.T*xMat
if np.linalg.det(xTx) == 0.0:
print ("This matrix is singular, cannot do inverse")
return
ws = xTx.I * (xMat.T*yMat)
return ws
xArr,yArr = loadDataSet('ex0.txt')
##ws = standRegres(xArr,yArr)
##print(xArr)
##print(yArr)
##print(ws)
xMat = np.mat(xArr)
yMat = np.mat(yArr)
##yHat = xMat*ws
##print(xMat)
##print(yMat)
##print(yHat)
def plotDataSet():
import matplotlib.pyplot as plt
fig = plt.figure()
ax = fig.add_subplot(111)
##print(np.shape(xMat[:,1].flatten().A[0]))
##print(np.shape(yMat[0,:].flatten().A[0]))
ax.scatter(xMat[:,1].flatten().A[0],yMat[0,:].flatten().A[0],s = 20, c = 'blue',alpha = .5)
xCopy = xMat.copy()
xCopy.sort(0)
yHat = xCopy*ws
#print(xCopy)
ax.plot(xCopy[:,1],yHat)
plt.show()
##plotDataSet()
#print(np.corrcoef(yHat.T,yMat)) #相关系数
#print(xArr)
def lwlr(testPoint, xArr, yArr, k = 1.0):
#print(xArr)
xMat = np.mat(xArr); yMat = np.mat(yArr).T
#print(xMat)
m = np.shape(xMat)[0]
weights = np.mat(np.eye((m))) #创建权重对角矩阵
for j in range(m): #遍历数据集计算每个样本的权重
#print(xMat[j,:])
diffMat = testPoint - xMat[j,:]
weights[j, j] = np.exp(diffMat * diffMat.T/(-2.0 * k**2))
xTx = xMat.T * (weights * xMat)
if np.linalg.det(xTx) == 0.0:
print("矩阵为奇异矩阵,不能求逆")
return
ws = xTx.I * (xMat.T * (weights * yMat)) #计算回归系数
return testPoint * ws
#print(lwlr(xArr[3],xArr,yArr,1.0))
##testArr = xArr
##m = np.shape(testArr)[0]
##yHat = np.zeros(m)
##for i in range(m):
## yHat[i] = lwlr(testArr[i],xArr,yArr,1.0)
def lwlrTest(testArr,xArr,yArr,k=1.0):
m = np.shape(testArr)[0] #计算测试数据集大小
yHat = np.zeros(m)
for i in range(m): #对每个样本点进行预测
yHat[i] = lwlr(testArr[i],xArr,yArr,k)
return yHat
yHat = lwlrTest(xArr,xArr,yArr,1.0)
#print(yHat)
srtInd = xMat[:,1].argsort(0)
xSort = xMat[srtInd][:,0]
ySort = yHat[srtInd]
##print(ySort)
##sSort_ = xMat[srtInd]
##print(srtInd)
##print(sSort)
##print(sSort_)
##print(xMat[srtInd][:,0,:])
##print(np.shape(sSort[:,1]))
##print(np.shape(yHat[srtInd]))
##print(yHat[srtInd][:])
##fig = plt.figure()
##ax = fig.add_subplot(111)
##ax.plot(xSort[:,1],ySort)
##ax.scatter(xMat[:,1].flatten().A[0],np.mat(yArr).T.flatten().A[0],s=2,c='red')
##plt.show()
def sub_plot():
yHat1 = lwlrTest(xArr,xArr,yArr,1.0)
yHat2 = lwlrTest(xArr,xArr,yArr,0.01)
yHat3 = lwlrTest(xArr,xArr,yArr,0.003)
srtInd = xMat[:,1].argsort(0)
xSort = xMat[srtInd][:,0]
ySort1 = yHat1[srtInd]
ySort2 = yHat2[srtInd]
ySort3 = yHat3[srtInd]
fig = plt.figure()
ax = fig.add_subplot(311)
ax.plot(xSort[:,1],ySort1)
ax.scatter(xMat[:,1].flatten().A[0],np.mat(yArr).T.flatten().A[0],s=2,c='red')
ax = fig.add_subplot(312)
ax.plot(xSort[:,1],ySort2)
ax.scatter(xMat[:,1].flatten().A[0],np.mat(yArr).T.flatten().A[0],s=2,c='red')
ax = fig.add_subplot(313)
ax.plot(xSort[:,1],ySort3)
ax.scatter(xMat[:,1].flatten().A[0],np.mat(yArr).T.flatten().A[0],s=2,c='red')
plt.show()
#sub_plot()
def rssError(yArr,yHatArr): #yArr and yHatArr both need to be arrays
return ((yArr-yHatArr)**2).sum()
abX,abY = loadDataSet('abalone.txt')
##yHat01 = lwlrTest(abX[0:99],abX[0:99],abY[0:99],0.1)
##yHat1 = lwlrTest(abX[0:99],abX[0:99],abY[0:99],1)
##yHat10 = lwlrTest(abX[0:99],abX[0:99],abY[0:99],10)
##print(rssError(abY[0:99],yHat01.T))
##print(rssError(abY[0:99],yHat1.T))
##print(rssError(abY[0:99],yHat10.T))
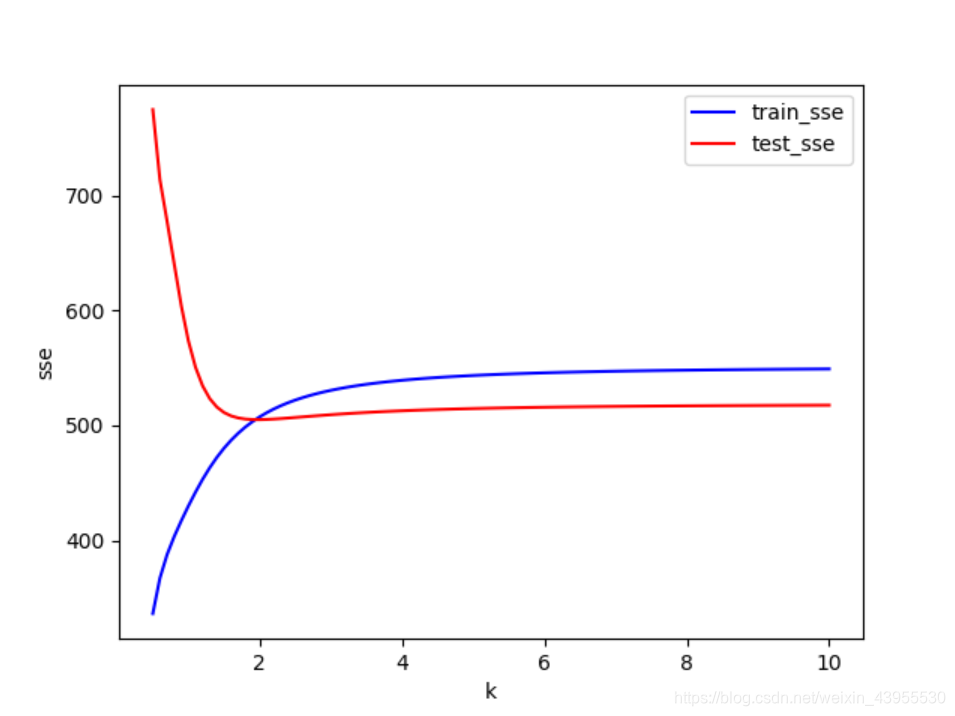
def showPlot():
train_sse = []
test_sse = []
for k in np.arange(0.5,10.1,0.1):
yHat1 = lwlrTest(abX[:99],abX[:99],abY[:99],k)
sse1 = rssError(abY[:99],yHat1)
train_sse.append(sse1)
#用后100个点带入到前100个点训练的模型中
yHat2 = lwlrTest(abX[100:199],abX[:99],abY[:99],k)
sse2 = rssError(abY[100:199],yHat2)
test_sse.append(sse2)
#print(train_sse)
fig = plt.figure()
ax = fig.add_subplot(111)
ax.plot(np.arange(0.5,10.1,0.1),train_sse,color = 'b')
ax.plot(np.arange(0.5,10.1,0.1),test_sse,color = 'r')
plt.xlabel('k')
plt.ylabel('sse')
plt.legend(['train_sse','test_sse'])
plt.show()
showPlot()
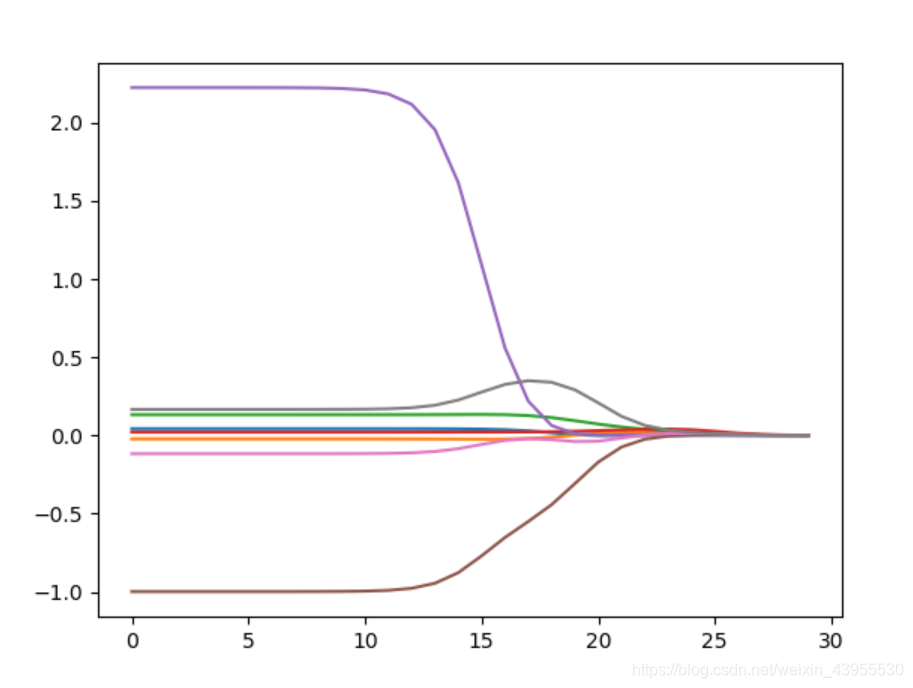
def ridgeRegres(xMat,yMat,lam=0.2):
    xTx = xMat.T*xMat
    denom = xTx + np.eye(np.shape(xMat)[1])*lam
    if np.linalg.det(denom) == 0.0:
        print ("This matrix is singular, cannot do inverse")
        return
    ws = denom.I * (xMat.T*yMat)
    return ws

def ridgeTest(xArr,yArr):
    xMat = np.mat(xArr); yMat=np.mat(yArr).T
    yMean = np.mean(yMat,0)
    yMat = yMat - yMean     #to eliminate X0 take mean off of Y
    #regularize X's
    xMeans = np.mean(xMat,0)   #calc mean then subtract it off
    xVar = np.var(xMat,0)      #calc variance of Xi then divide by it
    xMat = (xMat - xMeans)/xVar
    numTestPts = 30
    wMat = np.zeros((numTestPts,np.shape(xMat)[1]))
    for i in range(numTestPts):
        ws = ridgeRegres(xMat,yMat,np.exp(i-10))
        wMat[i,:]=ws.T
    return wMat

#print(ridgeTest(abX,abY))

ridgeWeights = ridgeTest(abX,abY)
fig = plt.figure()
ax = fig.add_subplot(111)
ax.plot(ridgeWeights)
plt.show()
def regularize(xMat): # regularize by columns
inMat = xMat.copy()
inMeans = np.mean(inMat, 0) # calc mean then subtract it off
inVar = np.var(inMat, 0) # calc variance of Xi then divide by it
inMat = (inMat - inMeans) / inVar
return inMat
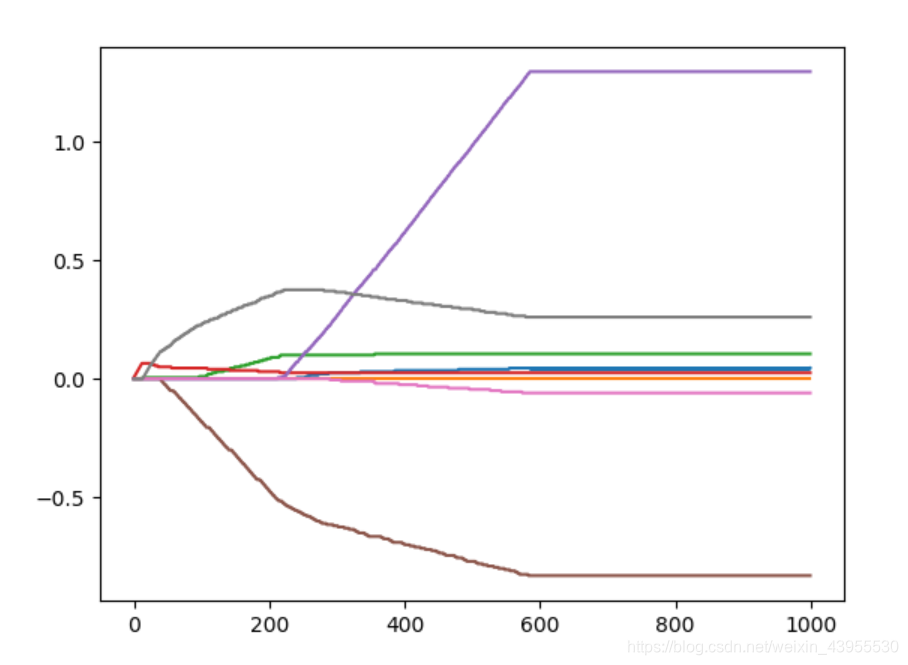
def stageWise(xArr,yArr,eps=0.01,numIt=100):
xMat = np.mat(xArr); yMat=np.mat(yArr).T
yMean = np.mean(yMat,0)
yMat = yMat - yMean #can also regularize ys but will get smaller coef
xMat = regularize(xMat)
m,n=np.shape(xMat)
returnMat = np.zeros((numIt,n)) #testing code remove
ws = np.zeros((n,1)); wsTest = ws.copy(); wsMax = ws.copy()
for i in range(numIt):
#print (ws.T)
lowestError = np.inf;
for j in range(n):
for sign in [-1,1]:
wsTest = ws.copy()
wsTest[j] += eps*sign
yTest = xMat*wsTest
rssE = rssError(yMat.A,yTest.A)
if rssE < lowestError:
lowestError = rssE
wsMax = wsTest
ws = wsMax.copy()
returnMat[i,:]=ws.T
return returnMat
#print(stageWise(abX,abY,0.01,200))