简述
这个操作很常用。用于做对比区分
代码范式:
ax.set_title(str)实例
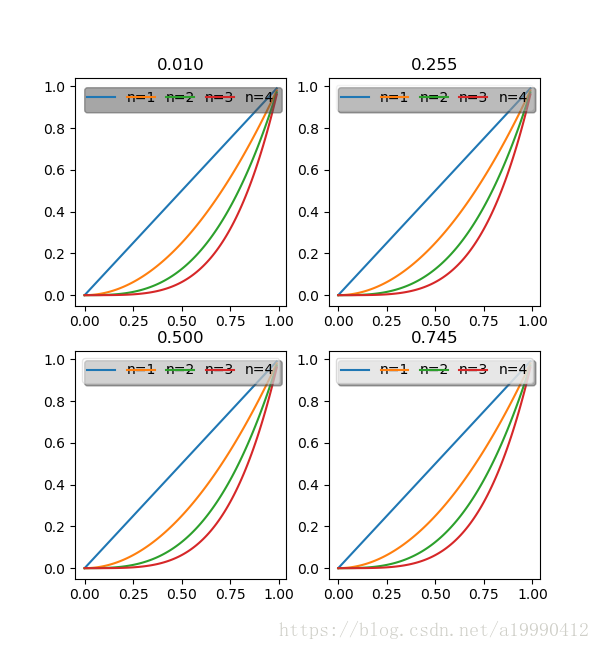
import matplotlib.pyplot as plt
import numpy as np
plt.figure(figsize=(6, 6.5))
for i in range(4):
    ax = plt.subplot(221+i)
    alpha = 0.98 / 4 * i + 0.01
    ax.set_title('%.3f' % alpha)
    t1 = np.arange(0.0, 1.0, 0.01)
    for n in [1, 2, 3, 4]:
        plt.plot(t1, t1 ** n, label="n=%d" % n)
    leg = plt.legend(loc='best', ncol=4, mode="expand", shadow=True)
    leg.get_frame().set_alpha(alpha)

plt.savefig('1.png')
plt.show()