此示例模拟多标签文档分类问题。 数据集是基于以下过程随机生成的:
- pick the number of labels: n ~ Poisson(n_labels) 选择标签数量:n~泊松(n_labels)
- n times, choose a class c: c ~ Multinomial(theta) n次,选择一个类c:c~多项(theta)
- pick the document length: k ~ Poisson(length) 挑选文件长度:k~泊松(长度)
- k times, choose a word: w ~ Multinomial(theta_c) k次,选一个词:w~多项(theta_c)
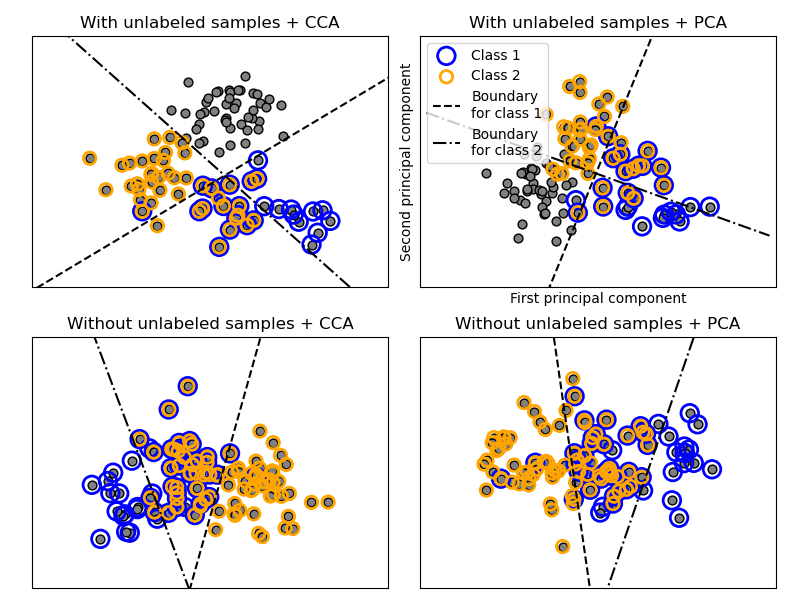
在上述过程中,拒绝采样用于确保n大于2,并且文档长度从不为零。 同样,我们拒绝已经选择的类。 分配给两个类的文档被两个彩色圆圈包围。
通过投影到PCA和CCA找到的前两个主要组件进行分类以进行可视化目的,然后使用sklearn.multiclass.OneVsRestClassifier元分类器,使用两个具有线性内核的SVC来学习每个类的判别模型。 请注意,PCA用于执行无监督降维,而CCA用于执行监督降维。
注意:在图中,“未标记的样本”并不意味着我们不知道标签(如在半监督学习中),而是样本根本没有标签。
print(__doc__)

import numpy as np
import matplotlib.pyplot as plt

from sklearn.datasets import make_multilabel_classification
from sklearn.multiclass import OneVsRestClassifier
from sklearn.svm import SVC
from sklearn.decomposition import PCA
from sklearn.cross_decomposition import CCA


def plot_hyperplane(clf, min_x, max_x, linestyle, label):
    # get the separating hyperplane
    w = clf.coef_[0]
    a = -w[0] / w[1]
    xx = np.linspace(min_x - 5, max_x + 5)  # make sure the line is long enough
    yy = a * xx - (clf.intercept_[0]) / w[1]
    plt.plot(xx, yy, linestyle, label=label)


def plot_subfigure(X, Y, subplot, title, transform):
    if transform == "pca":
        X = PCA(n_components=2).fit_transform(X)
    elif transform == "cca":
        X = CCA(n_components=2).fit(X, Y).transform(X)
    else:
        raise ValueError

    min_x = np.min(X[:, 0])
    max_x = np.max(X[:, 0])

    min_y = np.min(X[:, 1])
    max_y = np.max(X[:, 1])

    classif = OneVsRestClassifier(SVC(kernel='linear'))
    classif.fit(X, Y)

    plt.subplot(2, 2, subplot)
    plt.title(title)

    zero_class = np.where(Y[:, 0])
    one_class = np.where(Y[:, 1])
    plt.scatter(X[:, 0], X[:, 1], s=40, c='gray', edgecolors=(0, 0, 0))
    plt.scatter(X[zero_class, 0], X[zero_class, 1], s=160, edgecolors='b',
                facecolors='none', linewidths=2, label='Class 1')
    plt.scatter(X[one_class, 0], X[one_class, 1], s=80, edgecolors='orange',
                facecolors='none', linewidths=2, label='Class 2')

    plot_hyperplane(classif.estimators_[0], min_x, max_x, 'k--',
                    'Boundary\nfor class 1')
    plot_hyperplane(classif.estimators_[1], min_x, max_x, 'k-.',
                    'Boundary\nfor class 2')
    plt.xticks(())
    plt.yticks(())

    plt.xlim(min_x - .5 * max_x, max_x + .5 * max_x)
    plt.ylim(min_y - .5 * max_y, max_y + .5 * max_y)
    if subplot == 2:
        plt.xlabel('First principal component')
        plt.ylabel('Second principal component')
        plt.legend(loc="upper left")


plt.figure(figsize=(8, 6))

X, Y = make_multilabel_classification(n_classes=2, n_labels=1,
                                      allow_unlabeled=True,
                                      random_state=1)

plot_subfigure(X, Y, 1, "With unlabeled samples + CCA", "cca")
plot_subfigure(X, Y, 2, "With unlabeled samples + PCA", "pca")

X, Y = make_multilabel_classification(n_classes=2, n_labels=1,
                                      allow_unlabeled=False,
                                      random_state=1)

plot_subfigure(X, Y, 3, "Without unlabeled samples + CCA", "cca")
plot_subfigure(X, Y, 4, "Without unlabeled samples + PCA", "pca")

plt.subplots_adjust(.04, .02, .97, .94, .09, .2)
plt.show()sklearn.datasets.make_multilabel_classification
| Parameters: | n_samples : int, optional (default=100) The number of samples. n_features : int, optional (default=20) The total number of features. n_classes : int, optional (default=5) The number of classes of the classification problem. n_labels : int, optional (default=2) The average number of labels per instance. More precisely, the number of labels per sample is drawn from a Poisson distribution with length : int, optional (default=50) The sum of the features (number of words if documents) is drawn from a Poisson distribution with this expected value. allow_unlabeled : bool, optional (default=True) If sparse : bool, optional (default=False) If New in version 0.17: parameter to allow sparse output. return_indicator : ‘dense’ (default) | ‘sparse’ | False If return_distributions : bool, optional (default=False) If random_state : int, RandomState instance or None (default) Determines random number generation for dataset creation. Pass an int for reproducible output across multiple function calls. See Glossary. |
|---|---|
| Returns: | X : array of shape [n_samples, n_features] The generated samples. Y : array or sparse CSR matrix of shape [n_samples, n_classes] The label sets. p_c : array, shape [n_classes] The probability of each class being drawn. Only returned if p_w_c : array, shape [n_features, n_classes] The probability of each feature being drawn given each class. Only returned if |
sklearn.multiclass.OneVsRestClassifier
| Parameters: | estimator : estimator object An estimator object implementing fit and one of decision_function or predict_proba. n_jobs : int or None, optional (default=None) The number of jobs to use for the computation. |
|---|---|
| Attributes: | estimators_ : list of n_classes estimators Estimators used for predictions. classes_ : array, shape = [n_classes] Class labels. label_binarizer_ : LabelBinarizer object Object used to transform multiclass labels to binary labels and vice-versa.
Whether this is a multilabel classifier |
Methods
decision_function(X) |
Returns the distance of each sample from the decision boundary for each class. |
fit(X, y) |
Fit underlying estimators. |
get_params([deep]) |
Get parameters for this estimator. |
partial_fit(X, y[, classes]) |
Partially fit underlying estimators |
predict(X) |
Predict multi-class targets using underlying estimators. |
predict_proba(X) |
Probability estimates. |
score(X, y[, sample_weight]) |
Returns the mean accuracy on the given test data and labels. |
set_params(**params) |
Set the parameters of this estimator. |
__init__(estimator, n_jobs=None)[source]
decision_function(X)[source]
Returns the distance of each sample from the decision boundary for each class. This can only be used with estimators which implement the decision_function method.
| Parameters: | X : array-like, shape = [n_samples, n_features] |
|---|---|
| Returns: | T : array-like, shape = [n_samples, n_classes] |
fit(X, y)[source]
Fit underlying estimators.
| Parameters: | X : (sparse) array-like, shape = [n_samples, n_features] Data. y : (sparse) array-like, shape = [n_samples, ], [n_samples, n_classes] Multi-class targets. An indicator matrix turns on multilabel classification. |
|---|---|
| Returns: | self |
get_params(deep=True)[source]
Get parameters for this estimator.
| Parameters: | deep : boolean, optional If True, will return the parameters for this estimator and contained subobjects that are estimators. |
|---|---|
| Returns: | params : mapping of string to any Parameter names mapped to their values. |
multilabel_
Whether this is a multilabel classifier
partial_fit(X, y, classes=None)[source]
Partially fit underlying estimators
Should be used when memory is inefficient to train all data. Chunks of data can be passed in several iteration.
| Parameters: | X : (sparse) array-like, shape = [n_samples, n_features] Data. y : (sparse) array-like, shape = [n_samples, ], [n_samples, n_classes] Multi-class targets. An indicator matrix turns on multilabel classification. classes : array, shape (n_classes, ) Classes across all calls to partial_fit. Can be obtained via np.unique(y_all), where y_all is the target vector of the entire dataset. This argument is only required in the first call of partial_fit and can be omitted in the subsequent calls. |
|---|---|
| Returns: | self |
predict(X)[source]
Predict multi-class targets using underlying estimators.
| Parameters: | X : (sparse) array-like, shape = [n_samples, n_features] Data. |
|---|---|
| Returns: | y : (sparse) array-like, shape = [n_samples, ], [n_samples, n_classes]. Predicted multi-class targets. |