一、简介
Hystrix Dashboard是Hystrix的一个组件,Hystrix Dashboard提供一个断路器的监控面板,可以使我们更好的监控服务和集群的状态,仅仅使用Hystrix Dashboard只能监控到单个断路器的状态,实际开发中还需要结合Turbine使用
二、Hystrix Dashboard的使用
2.1 、在Ribbon+RestTemplate负载均衡中使用Hystrix Dashboard
第一步:在consulclient3中添加依赖
<!--断路器面板-->
        <dependency>
            <groupId>org.springframework.cloud</groupId>
            <artifactId>spring-cloud-starter-netflix-hystrix-dashboard</artifactId>
        </dependency>
第二步:配置Hystrix Stream 的urlMapping
由于在SpringBoot 2.0版本中已经不能自动配置urlMapping,所以需要手动配置了
@Configuration
public class HystrixConfiguration {
    @Bean
    public ServletRegistrationBean<HystrixMetricsStreamServlet> getServlet(){
        HystrixMetricsStreamServlet hystrixMetricsStreamServlet = new HystrixMetricsStreamServlet();
        ServletRegistrationBean<HystrixMetricsStreamServlet> servletRegistrationBean = new ServletRegistrationBean();
        servletRegistrationBean.setServlet(hystrixMetricsStreamServlet);
        servletRegistrationBean.addUrlMappings("/hystrix.stream");
        servletRegistrationBean.setName("HystrixMetricsStreamServlet");
        return servletRegistrationBean;
    }
}
第三步、Springboot Application中添加注解,并启动程序
@EnableHystrixDashboard //开启Dashboard第四步:查看面板
浏览器中打开localhost:9999/hystrix
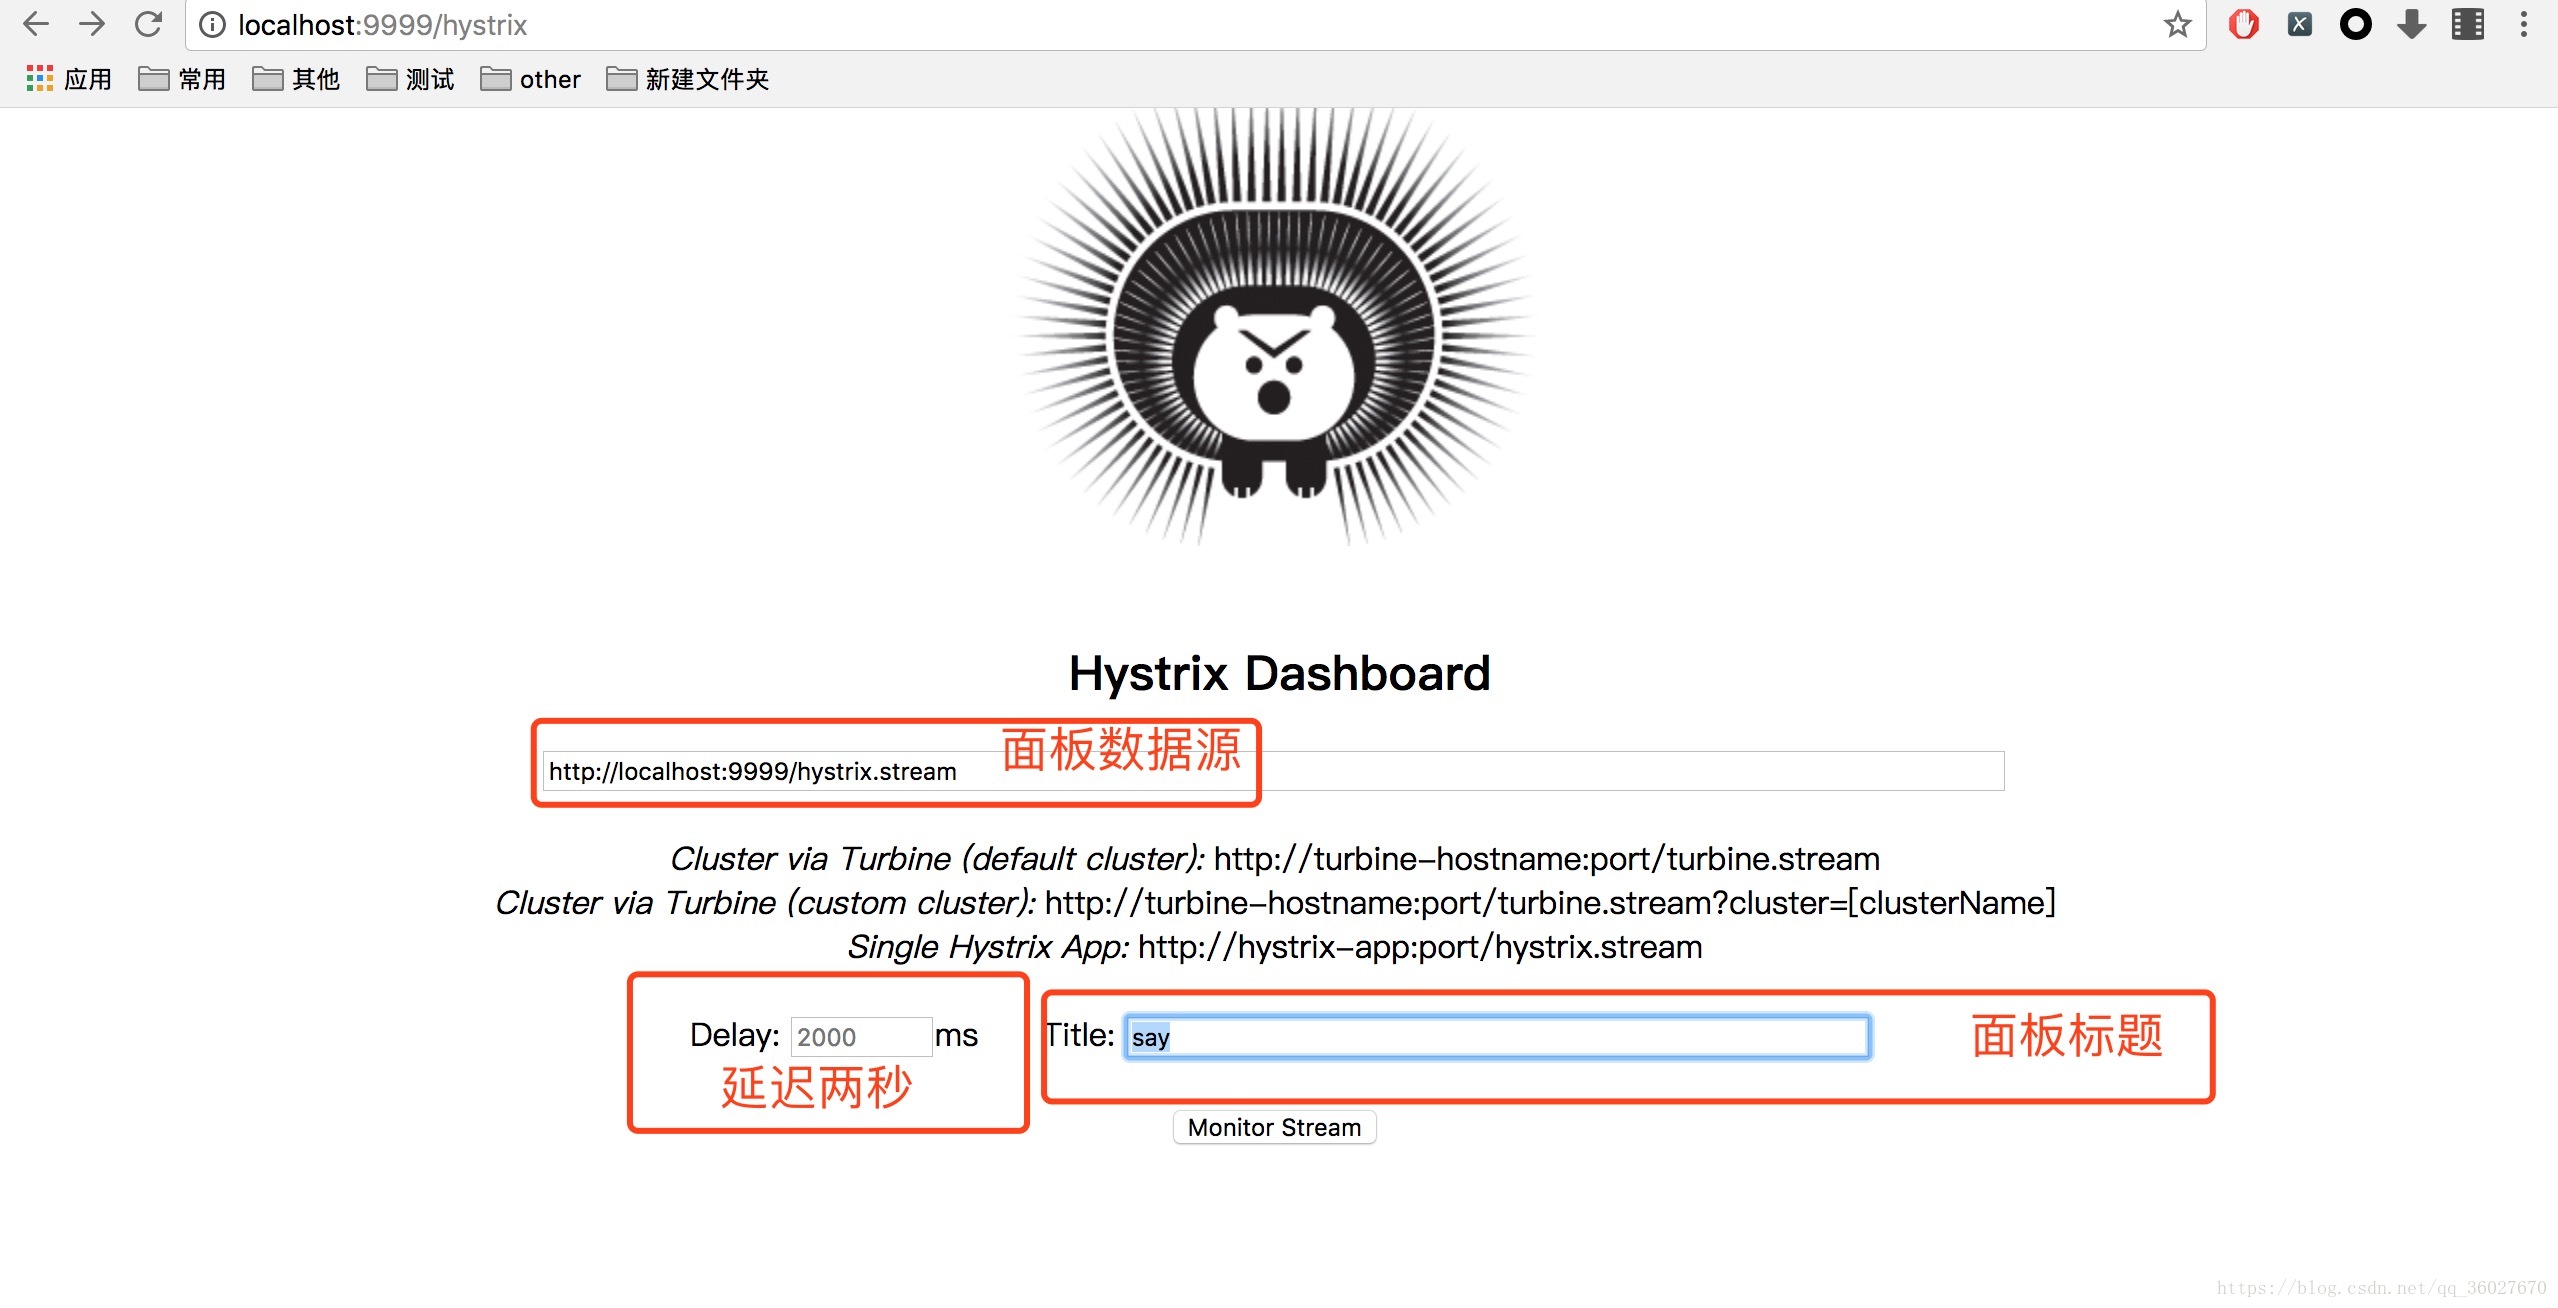
图中提示数据源有三种:
http://turbine-hostname:port/turbine.stream (所有集群)
http://turbine-hostname:port/turbine.stream?cluster=[clusterName](指定名称的集群)
http://hystrix-app:port/hystrix.stream(单个应用)
我们选择第三个,点击Moitor Stream会自动生成监控面板,我们就可以实时监控数据
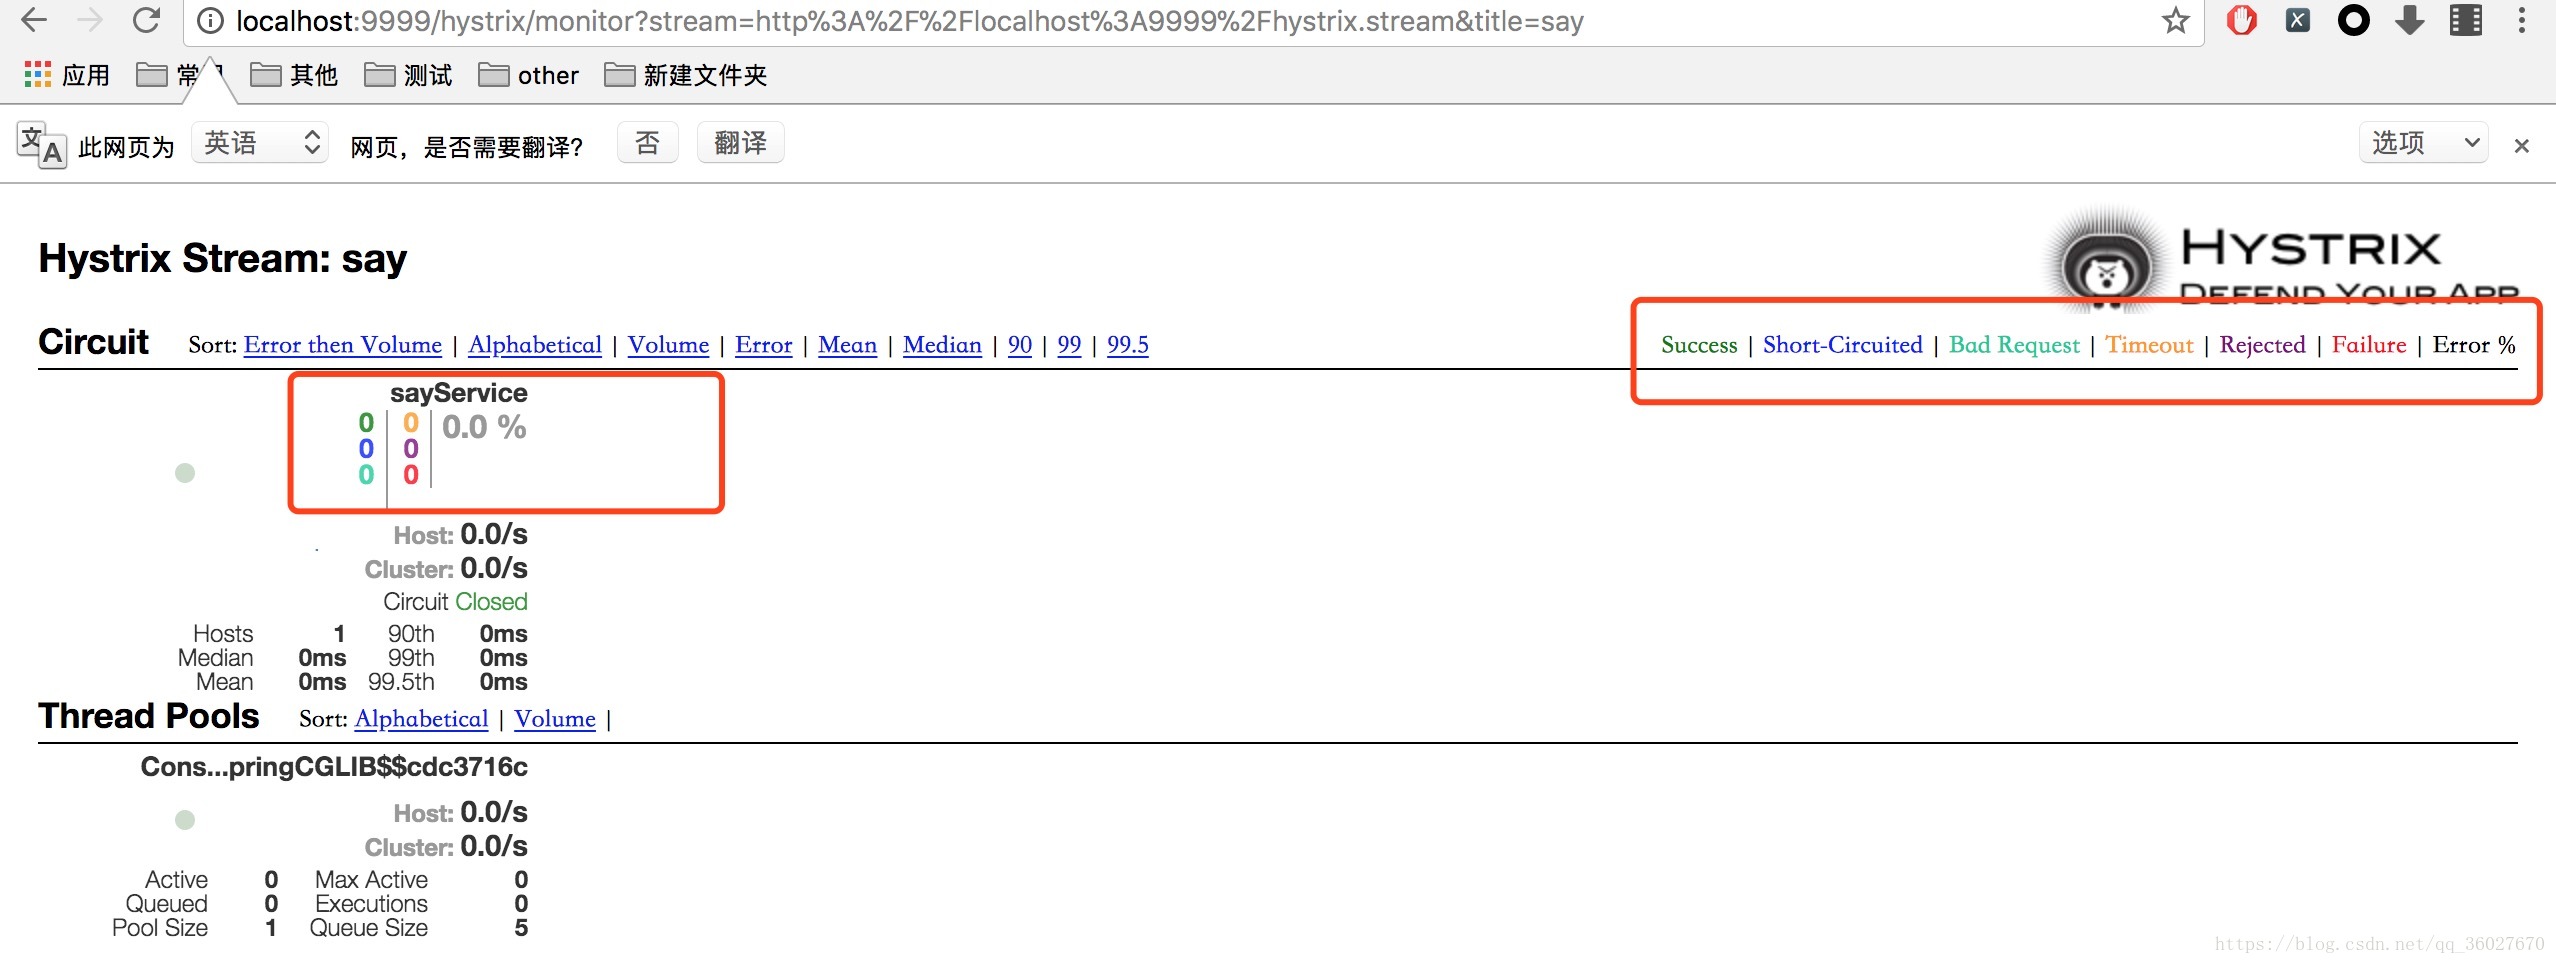
不同的颜色对对应断路器监控的百分比,通过统计10秒内得出的数据
2.1 、在Feign负载均衡中使用Hystrix Dashboard
注意:一定需要配置打开断路器
feign.hystrix.enabled=true其他步骤和2.1中相同
如果处于loading data状态,是为没有数据,调用服务就可以加载数据了