springcloud之Hystrix Dashboard监控
Hystrix Dashboard是什么
Hystrix提供了对于微服务调用状态的监控信息,但是需要结合spring-boot-actuator模块一起使用。Hystrix Dashboard是Hystrix的一个组件,Hystrix Dashboard提供一个断路器的监控面板,可以使我们更好的监控服务和集群的状态,仅仅使用Hystrix Dashboard只能监控到单个断路器的状态,实际开发中还需要结合Turbine使用。
Hystrix Dashboard作用
Hystrix Dashboard主要用来实时监控Hystrix的各项指标信息。通过Hystrix Dashboard反馈的实时信息,可以帮助我们快速发现系统中存在的问题。
Hystrix Dashboard使用
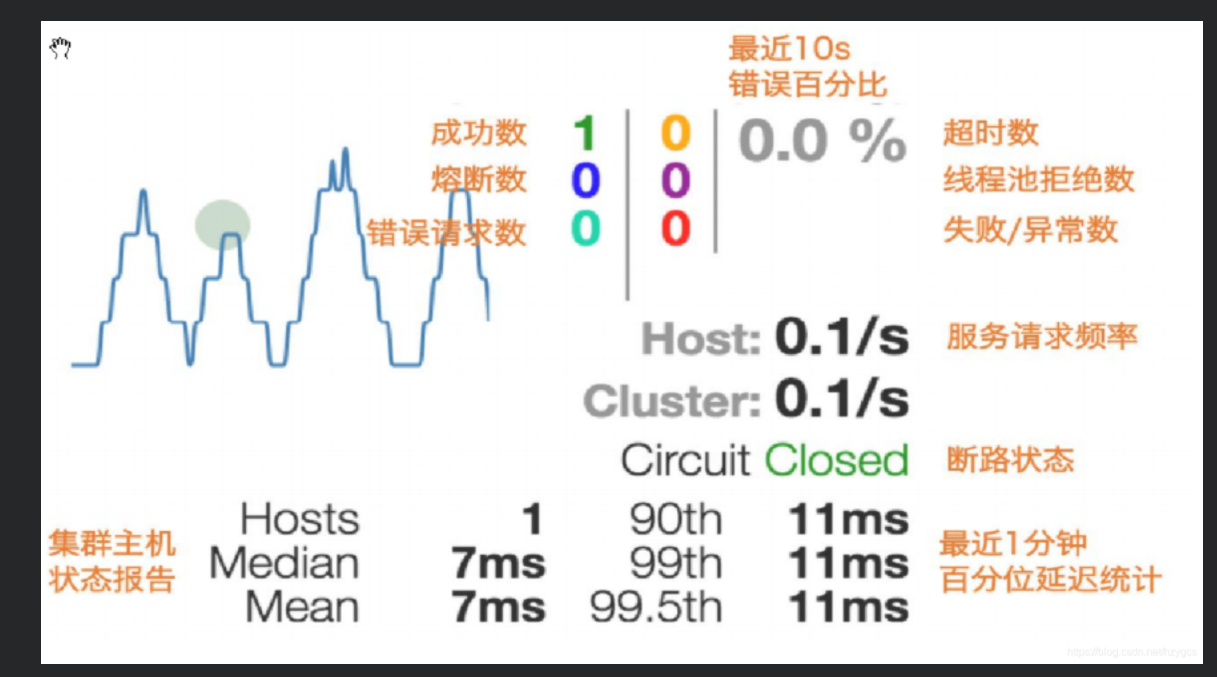
使用基于Hystrix的提供者访问数据库表数据,每访问一次都会记录是否成功以及最近10s错误百分比、超时数、熔断数、线程拒绝数、错误请求数、失败/异常数、服务请求频率等相关信息
1.创建一个Hystrix Dashboard服务
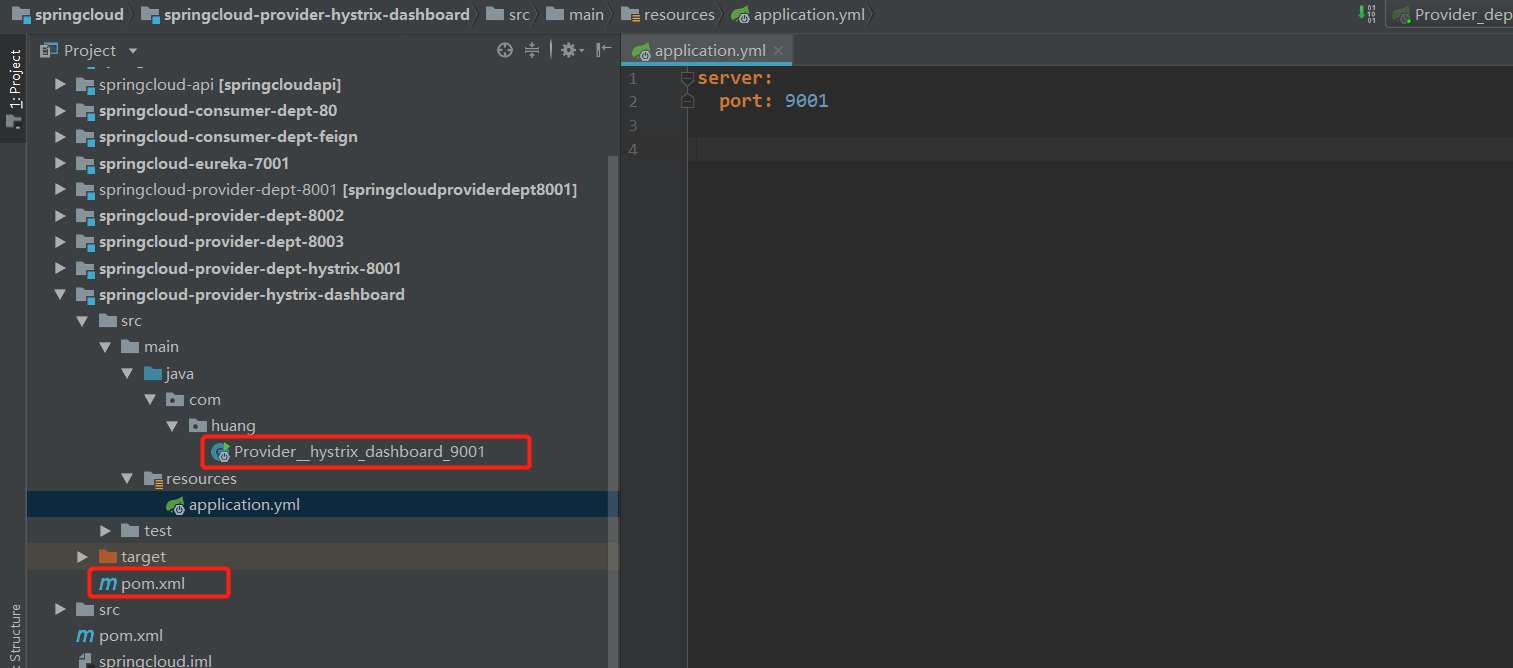
@SpringBootApplication
@EnableHystrixDashboard
public class Provider__hystrix_dashboard_9001 {


    public static void main(String[] args) {


        SpringApplication.run(Provider__hystrix_dashboard_9001.class,args);
    }

}
<?xml version="1.0" encoding="UTF-8"?>
<project xmlns="http://maven.apache.org/POM/4.0.0"
         xmlns:xsi="http://www.w3.org/2001/XMLSchema-instance"
         xsi:schemaLocation="http://maven.apache.org/POM/4.0.0 http://maven.apache.org/xsd/maven-4.0.0.xsd">
    <parent>
        <artifactId>spring-cloud</artifactId>
        <groupId>com.huang</groupId>
        <version>1.0-SNAPSHOT</version>
    </parent>
    <modelVersion>4.0.0</modelVersion>

    <artifactId>springcloud-provider-hystrix-dashboard</artifactId>


    <dependencies>
        <dependency>
            <groupId>org.springframework.cloud</groupId>
            <artifactId>spring-cloud-starter-hystrix-dashboard</artifactId>
            <version>1.4.6.RELEASE</version>
        </dependency>
        <dependency>
            <groupId>org.springframework.cloud</groupId>
            <artifactId>spring-cloud-starter-hystrix</artifactId>
            <version>1.4.6.RELEASE</version>
        </dependency>
        <!--ribbon-->
        <dependency>
            <groupId>org.springframework.cloud</groupId>
            <artifactId>spring-cloud-starter-ribbon</artifactId>
            <version>1.4.6.RELEASE</version>
        </dependency>

        <dependency>
            <groupId>org.springframework.cloud</groupId>
            <artifactId>spring-cloud-starter-eureka</artifactId>
            <version>1.4.6.RELEASE</version>
        </dependency>

        <dependency>
            <groupId>com.huang</groupId>
            <artifactId>springcloud-api</artifactId>
            <version>1.0-SNAPSHOT</version>
        </dependency>

        <dependency>
            <groupId>org.springframework.boot</groupId>
            <artifactId>spring-boot-starter-web</artifactId>
        </dependency>

        <dependency>
            <groupId>org.springframework.boot</groupId>
            <artifactId>spring-boot-devtools</artifactId>
        </dependency>
    </dependencies>
</project>
2.对需要被监控的服务进行配置,这里以springcloud之hystrix熔断和限流文章中熔断项目为基础进行配置
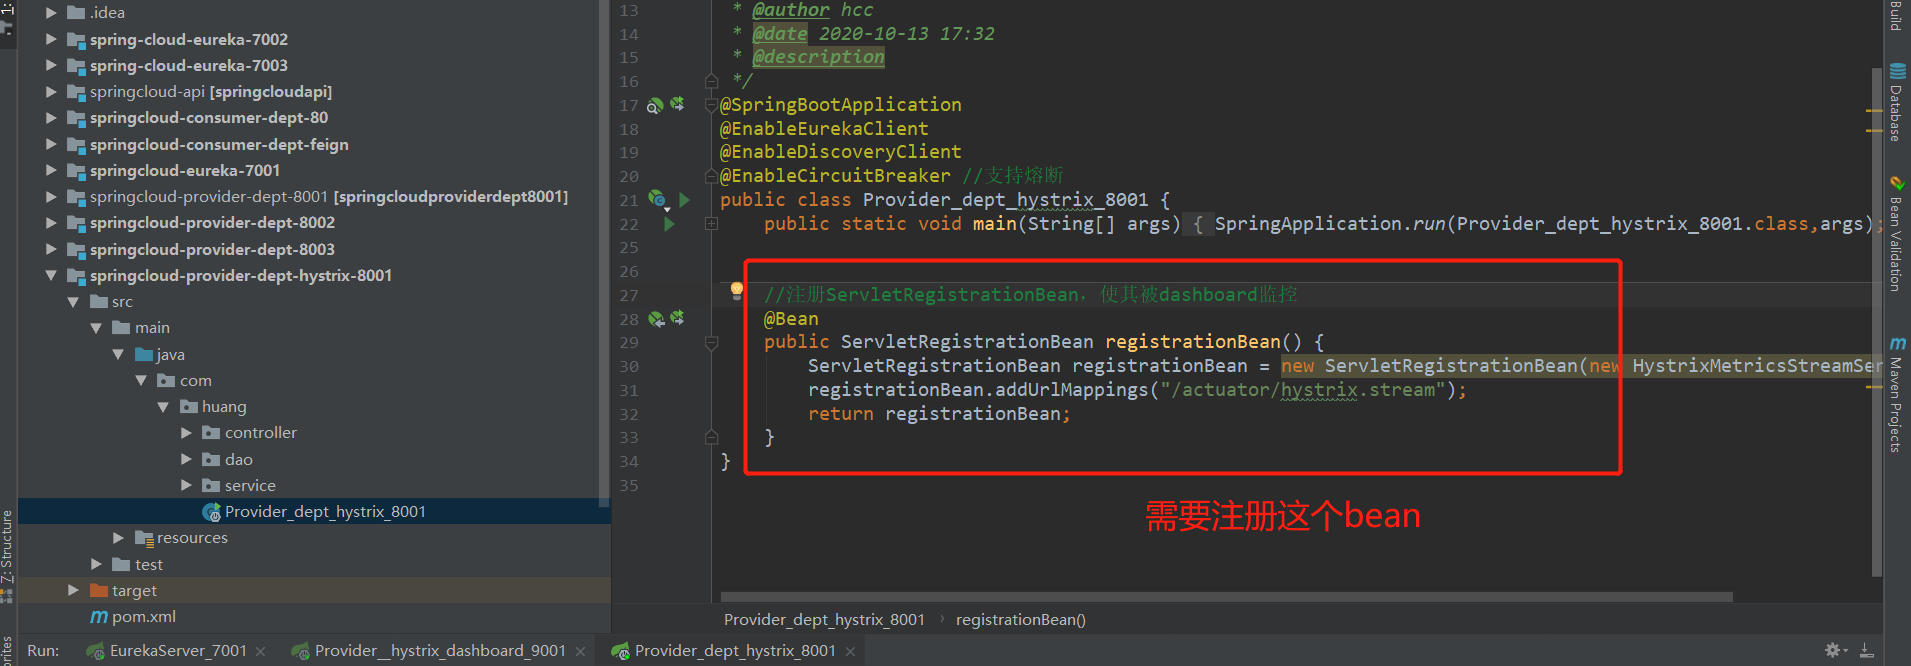
@SpringBootApplication
@EnableEurekaClient
@EnableDiscoveryClient
@EnableCircuitBreaker //支持熔断
public class Provider_dept_hystrix_8001 {


    public static void main(String[] args) {


        SpringApplication.run(Provider_dept_hystrix_8001.class,args);
    }


    //注册ServletRegistrationBean,使其被dashboard监控
    @Bean
    public ServletRegistrationBean registrationBean() {


        ServletRegistrationBean registrationBean = new ServletRegistrationBean(new HystrixMetricsStreamServlet());
        registrationBean.addUrlMappings("/actuator/hystrix.stream");
        return registrationBean;
    }
}
3.依次启动注册中心,Hystrix Dashboard和被监控的服务,访问Hystrix Dashboard首页如下

4.配置要监控的服务

扫描二维码关注公众号,回复:
11936496 查看本文章

5.进入监控页面
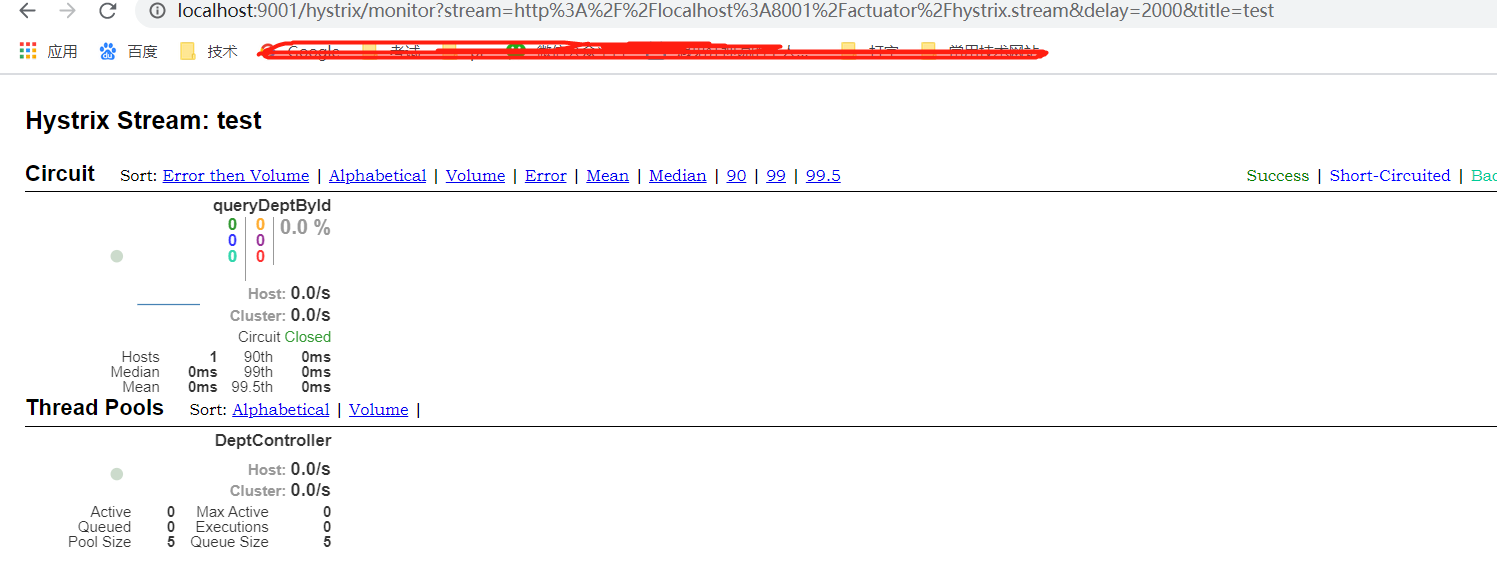
6.各参数意义