Flask速成项目:Flask实现计算机资源的实时监控

很多人都说使用Python开发WEB应用非常方便,那么对于WEB新手来说,到底有多方便呢?本文即将展示给你Python的魔法。 本文将通过一个实例:Flask实现计算机资源的实时监控,迅速带你入门Flask开发。 先说一下我的水平,博主的专业并不是做WEB开发的,对于WEB方面,只会写爬虫,因此,只能看懂html,略看得懂css与js,我估计有很多像我一样的小伙伴,因此,如果你的WEB掌握的水平在我之上或与我相当,那么,这篇文章将是你迅速入门Flask的终极教程

先放上一张成果图: 结果 
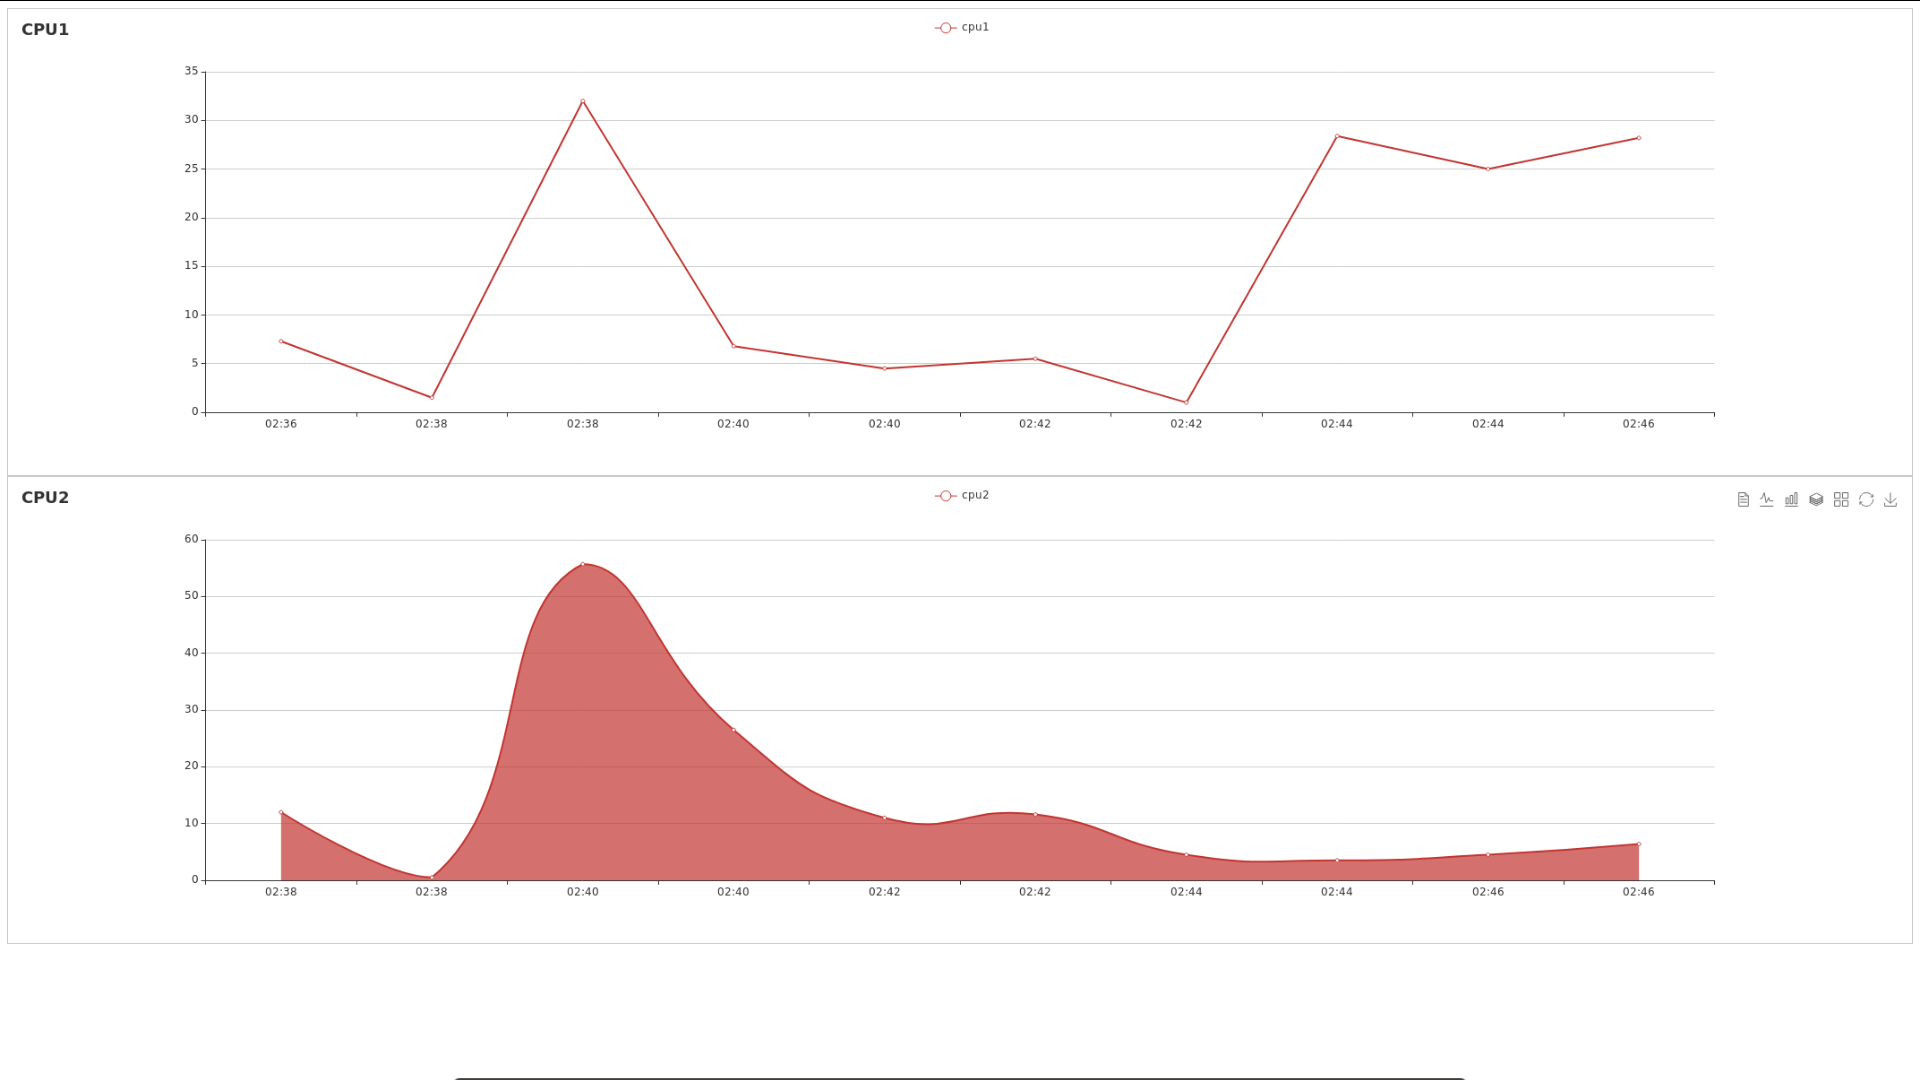
访问,浏览器能够实时显示我的电脑的两个CPU的使用情况,这里特地采用两种显示方式,方便大家学习代码。

flask介绍

Flask is a microframework for Python based on Werkzeug, Jinja 2 and good intentions. And before you ask: It’s BSD licensed! 搞科研或者搞技术,还是直接看英文吧,英文是你走向NB的基础。

flask安装

可以参考我之前的文章:

  1. Python配置虚拟环境
  2. ubuntu18.04 安装flask
  3. Flask项目结构

另外,需要安装psutilflask_socketio包,可直接使用pip安装

构建flask项目结构

在你的目录下新建如下的目录与文件:

boss@boss-N501JW:~/Desktop/projects/CPU_memory$ tree
.
|-- app.py
`-- templates
`-- index.html

1 directory, 2 files

非常形象的解释下flask完成的任务 浏览器向服务器发送请求,服务器将html源代码发送给浏览器,浏览器将html解析成可视化的东西展示给用户。也就是说,用户接收到的总是一个html文件,那flask在整个过程中完成了什么任务呢? 请把Flask想象成一个火腿肠加工厂,将输送给火腿肠加工厂火腿肠加工厂生产出火腿肠。同样,将用户请求,例如访问https://xujh.top这一请求发送给flaskflask能够生产出html。 将请求发送给flask是通过flask中的路由来实现的,flask是通过直接返回或返回模板来生成html的。

对于上述项目结构的构成,app.py中实现了路由及启动功能,templates文件夹中是模板文件,(这里插一句:我曾经看到很多人,在读某个用flask做的WEB项目的源码,一打开templates文件夹中,发现了很多css,js,html文件,一打开这些文件,发现几百上前行,一下子头都大了,立马放弃了读代码,哈哈哈哈),其实,对于像我一样专业不是做前端的小伙伴,完全可以不用担心,这些文件其实可以一行都不写,例如可以用Bootstrap框架来做前端,使用Bootstrap要写代码?兄弟,你不会用可视化编辑工具嘛!!! 等以后我们做大项目,我们主要写的也就是除了templates文件夹中以外的文件。前端不会别担心,我也不会。

对于这篇文章所要实现的目标,我们做一个小结:

  1. 执行app.py,计算机启动flask自带的服务器,开始允许WEB访问
  2. 用户使用浏览器访问网址
  3. flask接受到用户的请求后,app.py进行逻辑上的处理,将index.html传送给浏览器。

源码分析

app.py

源代码的分析在注释中,大家一定能看懂!

# -*- coding:utf-8 -*-
'''
CPU_and_MEM_Monitor
思路:后端后台线程一旦产生数据,即刻推送至前端。
好处:不需要前端ajax定时查询,节省服务器资源。
'''

import psutil #这个库可以用来获取系统的资源数据,详细可以看文档
import time

from threading import Lock

from flask import Flask, render_template, session, request
from flask_socketio import SocketIO, emit

# Set this variable to "threading", "eventlet" or "gevent" to test the
# different async modes, or leave it set to None for the application to choose
# the best option based on installed packages.
async_mode = None

app = Flask(__name__)
app.config['SECRET_KEY'] = 'secret!'
socketio = SocketIO(app, async_mode=async_mode)


thread = None
thread_lock = Lock()


# 后台线程 产生数据,即刻推送至前端
def background_thread():
count = 0
while True:
socketio.sleep(2)
count += 1
t = time.strftime('%M:%S', time.localtime()) # 获取系统时间(只取分:秒)
cpus = psutil.cpu_percent(interval=None, percpu=True) # 获取系统cpu使用率 non-blocking
socketio.emit('server_response',
{'data': [t] + list(cpus)[0:4], 'count': count},
namespace='/test') # 注意:这里不需要客户端连接的上下文,默认 broadcast = True !!!!!!!
print [t] +list(cpus)[0:4]
print 100*'*'

# 当用户访问'/'时,执行index()函数。这也是python装饰器的用法。
@app.route('/')
def index():
return render_template('index.html', async_mode=socketio.async_mode)
# 每次执行render_template函数时,渲染器都会将index.html的变量值用其实际值替代。


# 与前端建立 socket 连接后,启动后台线程
@socketio.on('connect', namespace='/test')
def test_connect():
global thread
with thread_lock:
if thread is None:
thread = socketio.start_background_task(target=background_thread)


if __name__ == '__main__':
socketio.run(app, debug=True)

index.html

<!DOCTYPE html>
<html lang="en">
<head>
<meta charset="utf-8">
<title>CPU_and_MEM_Monitor</title>
<script type="text/javascript" src="https://cdnjs.cloudflare.com/ajax/libs/jquery/3.3.1/jquery.min.js"></script>
<script type="text/javascript" src="https://cdn.bootcss.com/socket.io/1.5.1/socket.io.min.js"></script>
<!-- ECharts 3 引入 -->
<script src="http://echarts.baidu.com/dist/echarts.min.js"></script>
</head>

<body>
<!--为ECharts准备一个具备大小(宽高)的Dom-->
<div id="CPU1" style="height:500px;border:1px solid #ccc;padding:10px;"></div>
<div id="CPU2" style="height:500px;border:1px solid #ccc;padding:10px;"></div>
<script type="text/javascript">

//--- 折柱 ---
// 3个全局变量:time、cpu1、cpu2
var time = ["","","","","","","","","",""],
cpu1 = [0,0,0,0,0,0,0,0,0,0],
cpu2 = [0,0,0,0,0,0,0,0,0,0]

//第一张echarts图初始化
var CPU1 = echarts.init(document.getElementById('CPU1'));
CPU1.setOption({
title: {
text: 'CPU1'
},
tooltip: {},
legend: {
data:['cpu1']
},
xAxis: {
data: []
},
yAxis: {},
series: [{
name: 'cpu1',
type: 'line',
data: []
}]
});


//准备好的 callback 函数
var update_CPU1 = function (res) { //res是json格式的response对象

// 隐藏加载动画
CPU1.hideLoading();

// 准备数据
time.push(res.data[0]);
cpu1.push(parseFloat(res.data[1]));
if (time.length >= 10){
time.shift();
cpu1.shift();
}

// 填入数据
CPU1.setOption({
xAxis: {
data: time
},
series: [{
name: 'cpu1', // 根据名字对应到相应的系列
data: cpu1
}]
});

};

//第二张echarts图初始化
var CPU2 = echarts.init(document.getElementById('CPU2'));
CPU2.setOption({
title: {
text: 'CPU2'
},
tooltip: {},
legend: {
data:['cpu2']
},
toolbox: {
show : true,
feature : {
mark : {show: true},
dataView : {show: true, readOnly: false},
magicType : {show: true, type: ['line', 'bar', 'stack', 'tiled']},
restore : {show: true},
saveAsImage : {show: true}
}
},
calculable : true,
xAxis: {
data: []
},
yAxis: {},
series: [{
name: 'cpu2',
type: 'line',
smooth:true,
itemStyle: {normal: {areaStyle: {type: 'default'}}},
data: []
}]
});


//准备好的 callback 函数
var update_CPU2 = function (res) { //res是json格式的response对象

// 隐藏加载动画
CPU2.hideLoading();

// 准备数据
time.push(res.data[0]);
cpu2.push(parseFloat(res.data[2]));
if (time.length >= 10){
time.shift();
cpu2.shift();
}

// 填入数据
CPU2.setOption({
xAxis: {
data: time
},
series: [{
name: 'cpu2', // 根据名字对应到相应的系列
data: cpu2
}]
});

};

// 首次显示加载动画
CPU1.showLoading();
CPU2.showLoading();

// 建立socket连接,等待服务器“推送”数据,用回调函数更新图表
$(document).ready(function() {
namespace = '/test';
var socket = io.connect(location.protocol + '//' + document.domain + ':' + location.port + namespace);

socket.on('server_response', function(res) {
update_CPU1(res);
update_CPU2(res);
});

});

</script>
</body>
</html>

猜你喜欢

转载自www.cnblogs.com/sundahua/p/10219165.html
今日推荐