				版权声明:本文为博主原创文章,未经博主允许不得转载。					https://blog.csdn.net/akadiao/article/details/78535210				</div>
							            <div id="content_views" class="markdown_views">
						<!-- flowchart 箭头图标 勿删 -->
						<svg xmlns="http://www.w3.org/2000/svg" style="display: none;"><path stroke-linecap="round" d="M5,0 0,2.5 5,5z" id="raphael-marker-block" style="-webkit-tap-highlight-color: rgba(0, 0, 0, 0);"></path></svg>
						<p>tensorflow图像处理 <br>
一张RGB格式的彩色图像可以看成是一个三维矩阵,矩阵中的每一个数代表图像不同的位置上不同的颜色的亮度.但是图像存储时并不是直接存储这些三维矩阵,而是要先对其进行压缩编码再存储.因此读取图像的过程其实是先读取其压缩编码后的结果,然后将其解码的过程.
读取图像&转换格式
#!/usr/bin/python
# coding:utf-8
import matplotlib.pyplot as plt
import tensorflow as tf
# 读取图像数据
img = tf.gfile.FastGFile('daibola.jpg').read()
with tf.Session() as sess:
# 用ipeg格式将图像解码得到三维矩阵(png格式用decode_png)
# 解码后得到结果为张量
img_data = tf.image.decode_jpeg(img)
# 打印出得到的三维矩阵
print img_data.eval()
# 使用pyplot可视化得到的图像
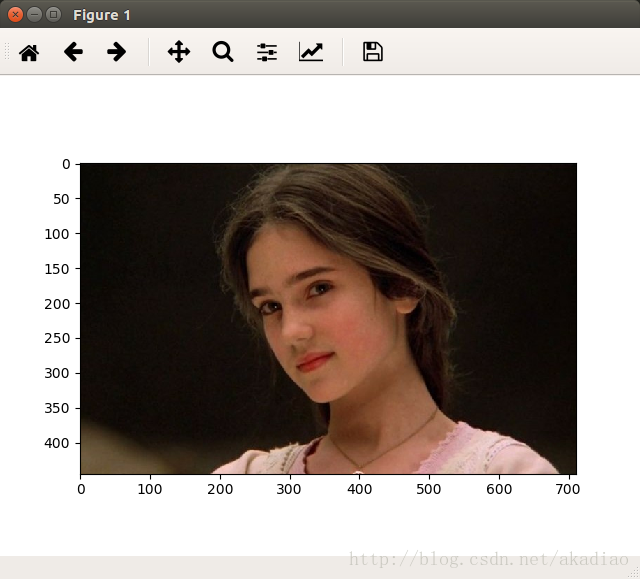
plt.imshow(img_data.eval())
plt.show()
#转换格式
# 转换图像的数据类型
img_data = tf.image.convert_image_dtype(img_data, dtype=tf.uint8)
# 将图像的三维矩阵重新按照png格式存入文件
encoded_image = tf.image.encode_png(img_data)
# 得到图像的png格式
with tf.gfile.GFile('model/model.png', 'wb') as f:
f.write(encoded_image.eval())
- 1
- 2
- 3
- 4
- 5
- 6
- 7
- 8
- 9
- 10
- 11
- 12
- 13
- 14
- 15
- 16
- 17
- 18
- 19
- 20
- 21
- 22
- 23
- 24
- 25
- 26
输出:
[[[ 19  18  16]
  [ 20  19  17]
  [ 22  21  19]
  ...,
  [ 22  21  19]
  [ 22  21  19]
  [ 22  21  19]]

 [[  8   7   5]
  [ 10   9   7]
  [ 11  10   8]
  ...,
  [  8   7   5]
  [  9   8   6]
  [ 10   9   7]]

 [[ 14  13  11]
  [ 15  14  12]
  [ 17  16  14]
  ...,
  [ 13  12  10]
  [ 13  12  10]
  [ 15  14  12]]

 ...,
 [[109  88  57]
  [109  88  57]
  [109  88  57]
  ...,
  [ 35  28  18]
  [ 35  28  18]
  [ 34  27  17]]

 [[109  88  57]
  [109  88  57]
  [109  88  57]
  ...,
  [ 34  27  17]
  [ 34  27  17]
  [ 34  27  17]]

 [[107  88  56]
  [107  88  56]
  [107  88  56]
  ...,
  [ 32  28  17]
  [ 33  29  18]
  [ 33  29  18]]]
- 1
- 2
- 3
- 4
- 5
- 6
- 7
- 8
- 9
- 10
- 11
- 12
- 13
- 14
- 15
- 16
- 17
- 18
- 19
- 20
- 21
- 22
- 23
- 24
- 25
- 26
- 27
- 28
- 29
- 30
- 31
- 32
- 33
- 34
- 35
- 36
- 37
- 38
- 39
- 40
- 41
- 42
- 43
- 44
- 45
- 46
- 47
- 48
- 49
				版权声明:本文为博主原创文章,未经博主允许不得转载。					https://blog.csdn.net/akadiao/article/details/78535210				</div>
							            <div id="content_views" class="markdown_views">
						<!-- flowchart 箭头图标 勿删 -->
						<svg xmlns="http://www.w3.org/2000/svg" style="display: none;"><path stroke-linecap="round" d="M5,0 0,2.5 5,5z" id="raphael-marker-block" style="-webkit-tap-highlight-color: rgba(0, 0, 0, 0);"></path></svg>
						<p>tensorflow图像处理 <br>