sklearn.model_selection.learning_curve
sklearn.model_selection.learning_curve(estimator, X, y, groups=None,
					train_sizes=array([0.1, 0.33, 0.55, 0.78, 1. ]),
					cv=’warn’, scoring=None,
					exploit_incremental_learning=False,
					n_jobs=None, pre_dispatch=’all’, verbose=0,
					shuffle=False, random_state=None,
					error_score=’raise-deprecating’)
Returns:
train_sizes_abs : array, shape (n_unique_ticks,), dtype int
Numbers of training examples that has been used to generate the learning curve. Note that the number of ticks might be less than n_ticks because duplicate entries will be removed.
train_scores : array, shape (n_ticks, n_cv_folds)
Scores on training sets.
test_scores : array, shape (n_ticks, n_cv_folds)
Scores on test set.
train_sizes指定训练样本数量的变化规则,比如np.linspace(.1, 1.0, 5)表示把训练样本数量从0.1~1分成五等分,从[0.1, 0.33, 0.55, 0.78, 1. ]的序列中取出训练样本数量百分比,逐个计算在当前训练样本数量情况下训练出来的模型准确性。
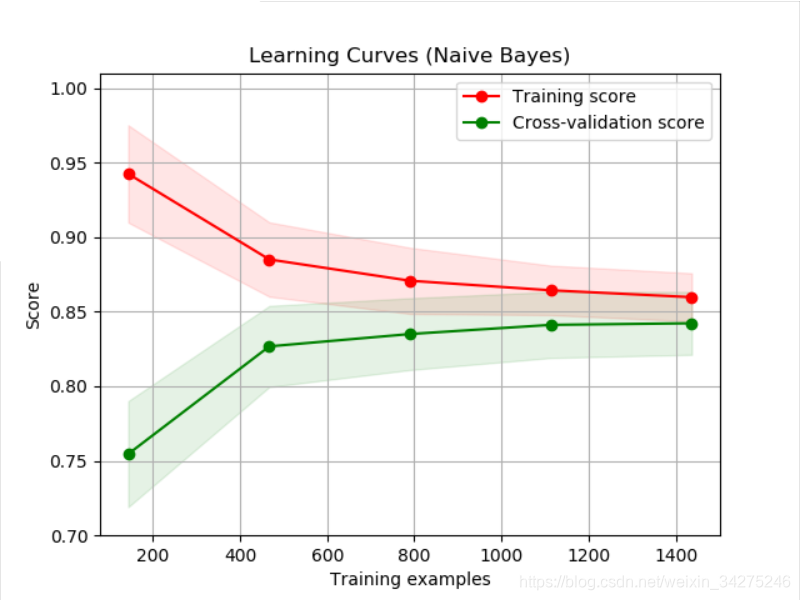
在画训练集的曲线时:横轴为 train_sizes,纵轴为 train_scores_mean;
画测试集的曲线时:横轴为train_sizes,纵轴为test_scores_mean。
import numpy as np
import matplotlib.pyplot as plt
from sklearn.naive_bayes import GaussianNB
from sklearn.svm import SVC
from sklearn.datasets import load_digits
from sklearn.model_selection import learning_curve
from sklearn.model_selection import ShuffleSplit


def plot_learning_curve(estimator, title, X, y,
			ylim=None, cv=None,n_jobs=None,
			train_sizes=np.linspace(.1, 1.0, 5)):
    plt.figure()
    plt.title(title)
    if ylim is not None:
        plt.ylim(*ylim)
    plt.xlabel("Training examples")
    plt.ylabel("Score")
    train_sizes, train_scores, test_scores = learning_curve(estimator, X, y,
    							cv=cv, n_jobs=n_jobs,
    							train_sizes=train_sizes)
    train_scores_mean = np.mean(train_scores, axis=1)
    train_scores_std = np.std(train_scores, axis=1)
    test_scores_mean = np.mean(test_scores, axis=1)
    test_scores_std = np.std(test_scores, axis=1)
    plt.grid()

    plt.fill_between(train_sizes, train_scores_mean - train_scores_std,
                     train_scores_mean + train_scores_std,
                     alpha=0.1, color="r")
    plt.fill_between(train_sizes, test_scores_mean - test_scores_std,
                     test_scores_mean + test_scores_std,
                     alpha=0.1, color="g")
    plt.plot(train_sizes, train_scores_mean, 'o-', color="r",
    		label="Training score")
    plt.plot(train_sizes, test_scores_mean, 'o-', color="g",
    		label="Cross-validation score")

    plt.legend(loc="best")
    return plt

digits = load_digits()
X, y = digits.data, digits.target

if __name__=='__main__':
	title = "Learning Curves (Naive Bayes)"
	# Cross validation with 100 iterations to get smoother mean test and train
	# score curves, each time with 20% data randomly selected as a validation set.
	cv = ShuffleSplit(n_splits=100, test_size=0.2, random_state=0)

	estimator = GaussianNB()
	plot_learning_curve(estimator, title, X, y, ylim=(0.7, 1.01), cv=cv, n_jobs=4)

	title = "Learning Curves (SVM, RBF kernel, $\gamma=0.001$)"
	# SVC is more expensive so we do a lower number of CV iterations:
	cv = ShuffleSplit(n_splits=10, test_size=0.2, random_state=0)
	estimator = SVC(gamma=0.001)
	plot_learning_curve(estimator, title, X, y, (0.7, 1.01), cv=cv, n_jobs=4)

	plt.show()
ImportError: [joblib] Attempting to do parallel computing without protecting your import on a system that does not support forking.
只需在主代码前加if name==‘main’:即可。
title:图像的名字。
cv : 整数, 交叉验证生成器或可迭代的可选项,确定交叉验证拆分策略。
Determines the cross-validation splitting strategy. Possible inputs for cv are:
- 无,使用默认的3倍交叉验证,
- 整数,指定折叠数。
- 要用作交叉验证生成器的对象。
- 可迭代的yielding训练/测试分裂。
ShuffleSplit:我们这里设置cv,交叉验证使用ShuffleSplit方法,一共取得100组训练集与测试集,每次的测试集为20%,它返回的是每组训练集与测试集的下标索引,由此可以知道哪些是train,那些是test。
ylim:tuple, shape (ymin, ymax), 可选的。定义绘制的最小和最大y值,这里是(0.7,1.01)。
n_jobs : 整数,可选并行运行的作业数(默认值为1)。windows开多线程需要在if “name” == “main”: 中运行。

参考地址:
sklearn.model_selection.ShuffleSplit
ShuffleSplit(n_splits=10, test_size=’default’, train_size=None, random_state=None)
用于将样本集合随机“打散”后划分为训练集、测试集。
matplotlib.pyplot.fill_between
基于matplotlib的数据可视化(图形填充fill、fill_between)

