数据摄取和检查
了解Panda的DataFrames。 使用Pandas导入和检查各种数据集,范围从从世界银行获得的人口数据到通过Yahoo!获得的月度股票数据。 金融。 从头开始练习构建DataFrame,并熟悉Pandas的内在数据可视化功能。
一、NumPy和pandas一起工作
Pandas依赖于NumPy,并与之互操作,NumPy是用于快速数值数组计算的Python库。 例如,使用DataFrame属性.values将DataFrame df表示为NumPy数组。 还可以将pandas数据结构传递给NumPy。 将pandas作为pd导入,并且自1960年以来每10年将世界人口数据加载到DataFrame df中。
提取值并使用属性.values将它们存储在数组中。 然后,使用这些值作为NumPy np.log10()方法的输入,以计算总体值的基数10对数。 最后,将整个pandas DataFrame传递到相同的NumPy np.log10()方法并比较结果。
# Import numpy
import numpy as np

# Create array of DataFrame values: np_vals
np_vals = df.values

# Create new array of base 10 logarithm values: np_vals_log10
np_vals_log10 = np.log10(np_vals)

# Create array of new DataFrame by passing df to np.log10(): df_log10
df_log10 = np.log10(df)

# Print original and new data containers
[print(x, 'has type', type(eval(x))) for x in ['np_vals', 'np_vals_log10', 'df', 'df_log10']]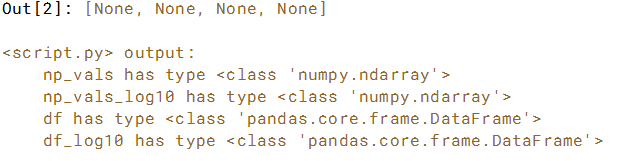
二、重头构造DataFrame
1、Zip列表以构建DataFrame
通过首先构建字典,制作自1896年以来赢得金牌的前三个国家的pandas数据框架。 list_keys包含列名“Country”和“Total”。 list_values包含每个国家的全名和获得的金牌数量。 这些值来自维基百科。
使用这些列表构建元组列表,使用元组列表构建字典,然后使用该字典构建DataFrame。 使用list(),zip(),dict()和pd.DataFrame()函数。 注意:Python 3及更高版本中的zip()函数返回一个特殊的zip对象,它本质上是一个生成器。 要将此zip对象转换为列表,需要使用list()。
import pandas as pd
# Zip the 2 lists together into one list of (key,value) tuples: zipped
zipped = list(zip(list_keys,list_values))

# Inspect the list using print()
print(zipped)

# Build a dictionary with the zipped list: data
data = dict(zipped)
print(data)

# Build and inspect a DataFrame from the dictionary: df
df = pd.DataFrame(data)
print(df)
2、标记数据
可以使用DataFrame属性df.columns查看并为pandas DataFrame中的列分配新的字符串标签。
我们将pandas导入为pd,并定义了一个包含20世纪80年代顶级Billboard命中数据的DataFrame df(来自维基百科)。 每行都有年份,艺术家,歌曲名称和顶部的周数。 但是,此DataFrame具有列标签a,b,c,d。 使用df.columns属性重新指定描述性列标签。
import pandas as dp

dp.set_option('display.max_column',None)
print(df)
# Build a list of labels: list_labels
list_labels = ['year','artist','song','chart weeks']

# Assign the list of labels to the columns attribute: df.columns
df.columns = list_labels
print(df)
3、使用广播构建DataFrame
在创建pandas DataFrame时,可以隐式使用NumPy的“广播”功能。 在本练习中,创建宾夕法尼亚州城市的DataFrame,其中包含城市名称在第一列和州名称在第二列。 我们已将15个城市的名称导入列表cities。
使用cities列表和字符串'PA'构建一个DataFrame。
# Make a string with the value 'PA': state
state = 'PA'

# Construct a dictionary: data
data = {'state':state, 'city':cities}

# Construct a DataFrame from dictionary data: df
df = pd.DataFrame(data)

# Print the DataFrame
print(df)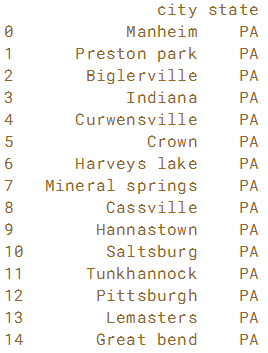
三、导入和导出数据
1、读一个平面文件
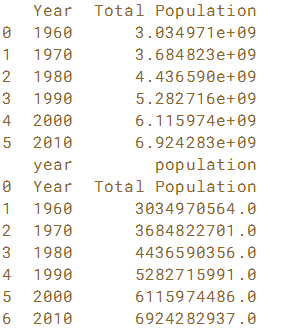
使用read_csv()读取在DataFrame中看到的世界银行人口数据。 该文件存储到变量data_file中。
下一步是重新读取同一文件,但同时使用names关键字输入参数重命名列,同时需要设置header = 0来重命名列标签。
pandas已经导入并在工作区中以pd格式提供。
# Read in the file: df1
df1 = pd.read_csv(data_file)

# Create a list of the new column labels: new_labels
new_labels = ['year','population']

# Read in the file, specifying the header and names parameters: df2
df2 = pd.read_csv(data_file, header=0, names=new_labels)
#df2 = pd.read_csv(data_file,names=new_labels)

# Print both the DataFrames
print(df1)
print(df2)
2、分隔符,标题和扩展名(Delimiters, headers, and extensions)
并非所有数据文件都干净整洁。 Pandas提供了读取经常遇到的那些不那么完美的数据文件的方法。
使用从雅虎财经下载的四家公司的月度股票数据。每个公司的数据存储为一行,每列是月末收盘价。文件存储在变量file_messy中。此外,此文件有三个方面可能会出现问题:多个标题行,在整个数据行中交错的注释记录(行)和空格分隔符而不是逗号。使用pandas来读取这个有问题的file_messy中的数据,使用非默认的输入选项和read_csv(),以便在读取时整理混乱。然后,将清理后的数据写入CSV文件,其中包含准备好的变量file_clean。
header : 用来作为列名的行号。默认为0(第一行),如果没有header行应该设置为None。
如果明确设定header=0 就会替换掉原来存在列名。header参数可以是一个list例如:[0,1,3],这个list表示将文件中的这些行作为列标题(意味着每一列有多个标题),介于中间的行将被忽略掉(例如本例中的2;本例中的数据1,2,4行将被作为多级标题出现,第3行数据将被丢弃,dataframe的数据从第5行开始。)。
注意:如果skip_blank_lines=True 那么header参数忽略注释行和空行,所以header=0表示第一行数据而不是文件的第一行。
comment:用于将注释信息从行尾拆分出去的字符(一个或多个)
# Read the raw file as-is: df1
df1 = pd.read_csv(file_messy)

# Print the output of df1.head()
print(df1.head())

# Read in the file with the correct parameters: df2
df2 = pd.read_csv(file_messy, delimiter=' ', header=3, comment='#')

# Print the output of df2.head()
print(df2.head())

# Save the cleaned up DataFrame to a CSV file without the index
df2.to_csv(file_clean, index=False)

# Save the cleaned up DataFrame to an excel file without the index
df2.to_excel('file_clean.xlsx', index=False)
四、
1、使用pandas绘制serise
pandas .plot()方法调用matplotlib来构造图。这意味着可以使用在以前的可视化课程中学到的技能来自定义绘图。在本练习中,为图形添加自定义标题和轴标签。
# Create a plot with color='red'
df.plot(color='red')

# Add a title
plt.title('Temperature in Austin')

# Specify the x-axis label
plt.xlabel('Hours since midnight August 1, 2010')

# Specify the y-axis label
plt.ylabel('Temperature (degrees F)')

# Display the plot
plt.show()

2、绘制DataFrames
比较几列的数据可能非常有启发性。 Pandas使用多列DataFrame轻松完成。默认情况下,调用df.plot()将导致pandas覆盖所有列数据,每列作为单行。在本练习中,我们预装了天气数据集中的三列数据 , 温度,露点和压力 - 但问题是压力具有不同的测量单位。在Atmospheres中测量的压力数据具有与其他两个数据列不同的垂直比例,其它两列均以华氏度为单位测量。
将所有列绘制为多线图,以查看垂直缩放问题的性质。然后,使用传递到DataFrame df [column_list]的列名列表将绘图限制为仅一列,然后仅限于2列数据。

# Plot all columns (default)
df.plot()
plt.show()

# Plot all columns as subplots
df.plot(subplots=True)
plt.show()

# Plot just the Dew Point data
column_list1 = ['Dew Point (deg F)']
df[column_list1].plot()
plt.show()

# Plot the Dew Point and Temperature data, but not the Pressure data
column_list2 = ['Temperature (deg F)','Dew Point (deg F)']
df[column_list2].plot()
plt.show()


