import  tensorflow as tf
from matplotlib import pyplot as plt
import numpy as np

train_x = np.linspace(-1, 1, 100)
train_y_1 = 2*train_x + np.random.rand(*train_x.shape)*0.3
train_y_2 = train_x**2+np.random.randn(*train_x.shape)*0.3

plt.scatter(train_x, train_y_1, c='red', marker='v' )
plt.scatter(train_x, train_y_2, c='blue', marker='o' )
plt.legend(["red","Blue"])
plt.show()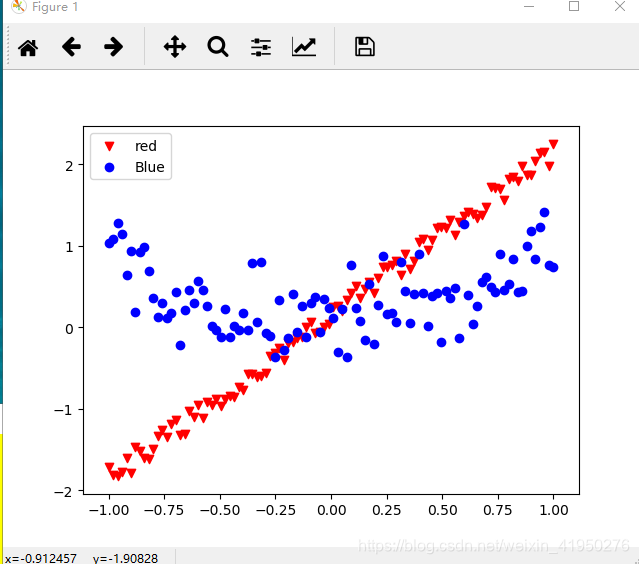
plt.legend()函数主要的作用就是给图加上图例,plt.legend([x,y,z])里面的参数使用的是list的的形式将图表的的名称喂给这和函数。