版权声明:本文为博主原创文章,未经博主允许不得转载。 https://blog.csdn.net/boonya/article/details/84100386
InfluxDB 存储数据的时候可以将多个字段的值一起存进去,需要时再按需获取就可以了,不需要多次分表存储。结合 Grafana来监控我们的历史统计数据。
目录
InfluxDB存储数据
Docker 运行命令
docker run -d --name influxdb -p 8086:8086 -p 8083:8083 influxdb:latest创建数据模型
保存数据可以用定时任务来做,这里只说在有数据的情况下怎么让数据在Grafana中显示。
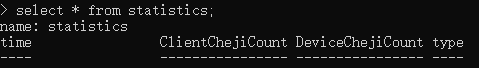
设计表:statistics
标签:all
字段:ClientChejiCount,DeviceChejiCount

Grafana使用
登录访问
Docker 运行命令:
docker run -d -p 3000:3000 --name grafana grafana/grafana:latest访问地址:http://localhost:3000 admin/admin
数据源设置

在线数据汇总展示


客户端在线数量

设备端在线数量

匿名访问
此时需要设置匿名访问策略,grafana为我们考虑到了这一点,需要修改defaults.ini配置实现。完整配置文件如下:
##################### Grafana Configuration Defaults #####################
#
# Do not modify this file in grafana installs
#

# possible values : production, development
app_mode = production

# instance name, defaults to HOSTNAME environment variable value or hostname if HOSTNAME var is empty
instance_name = ${HOSTNAME}

#################################### Paths ###############################
[paths]
# Path to where grafana can store temp files, sessions, and the sqlite3 db (if that is used)
data = data

# Temporary files in `data` directory older than given duration will be removed
temp_data_lifetime = 24h

# Directory where grafana can store logs
logs = data/log

# Directory where grafana will automatically scan and look for plugins
plugins = data/plugins

# folder that contains provisioning config files that grafana will apply on startup and while running.
provisioning = conf/provisioning

#################################### Server ##############################
[server]
# Protocol (http, https, socket)
protocol = http

# The ip address to bind to, empty will bind to all interfaces
http_addr =

# The http port  to use
http_port = 3000

# The public facing domain name used to access grafana from a browser
domain = localhost

# Redirect to correct domain if host header does not match domain
# Prevents DNS rebinding attacks
enforce_domain = false

# The full public facing url
root_url = %(protocol)s://%(domain)s:%(http_port)s/

# Log web requests
router_logging = false

# the path relative working path
static_root_path = public

# enable gzip
enable_gzip = false

# https certs & key file
cert_file =
cert_key =

# Unix socket path
socket = /tmp/grafana.sock

#################################### Database ############################
[database]
# You can configure the database connection by specifying type, host, name, user and password
# as separate properties or as on string using the url property.

# Either "mysql", "postgres" or "sqlite3", it's your choice
type = sqlite3
host = 127.0.0.1:3306
name = grafana
user = root
# If the password contains # or ; you have to wrap it with triple quotes. Ex """#password;"""
password =
# Use either URL or the previous fields to configure the database
# Example: mysql://user:secret@host:port/database
url =

# Max idle conn setting default is 2
max_idle_conn = 2

# Max conn setting default is 0 (mean not set)
max_open_conn =

# Connection Max Lifetime default is 14400 (means 14400 seconds or 4 hours)
conn_max_lifetime = 14400

# Set to true to log the sql calls and execution times.
log_queries =

# For "postgres", use either "disable", "require" or "verify-full"
# For "mysql", use either "true", "false", or "skip-verify".
ssl_mode = disable

ca_cert_path =
client_key_path =
client_cert_path =
server_cert_name =

# For "sqlite3" only, path relative to data_path setting
path = grafana.db

#################################### Session #############################
[session]
# Either "memory", "file", "redis", "mysql", "postgres", "memcache", default is "file"
provider = file

# Provider config options
# memory: not have any config yet
# file: session dir path, is relative to grafana data_path
# redis: config like redis server e.g. `addr=127.0.0.1:6379,pool_size=100,db=grafana`
# postgres: user=a password=b host=localhost port=5432 dbname=c sslmode=disable
# mysql: go-sql-driver/mysql dsn config string, examples:
#         `user:password@tcp(127.0.0.1:3306)/database_name`
#         `user:password@unix(/var/run/mysqld/mysqld.sock)/database_name`
# memcache: 127.0.0.1:11211


provider_config = sessions

# Session cookie name
cookie_name = grafana_sess

# If you use session in https only, default is false
cookie_secure = false

# Session life time, default is 86400
session_life_time = 86400
gc_interval_time = 86400

# Connection Max Lifetime default is 14400 (means 14400 seconds or 4 hours)
conn_max_lifetime = 14400

#################################### Data proxy ###########################
[dataproxy]

# This enables data proxy logging, default is false
logging = false

#################################### Analytics ###########################
[analytics]
# Server reporting, sends usage counters to stats.grafana.org every 24 hours.
# No ip addresses are being tracked, only simple counters to track
# running instances, dashboard and error counts. It is very helpful to us.
# Change this option to false to disable reporting.
reporting_enabled = true

# Set to false to disable all checks to https://grafana.com
# for new versions (grafana itself and plugins), check is used
# in some UI views to notify that grafana or plugin update exists
# This option does not cause any auto updates, nor send any information
# only a GET request to https://grafana.com to get latest versions
check_for_updates = true

# Google Analytics universal tracking code, only enabled if you specify an id here
google_analytics_ua_id =

# Google Tag Manager ID, only enabled if you specify an id here
google_tag_manager_id =

#################################### Security ############################
[security]
# default admin user, created on startup
admin_user = admin

# default admin password, can be changed before first start of grafana,  or in profile settings
admin_password = admin

# used for signing
secret_key = SW2YcwTIb9zpOOhoPsMm

# Auto-login remember days
login_remember_days = 7
cookie_username = grafana_user
cookie_remember_name = grafana_remember

# disable gravatar profile images
disable_gravatar = false

# data source proxy whitelist (ip_or_domain:port separated by spaces)
data_source_proxy_whitelist =

# disable protection against brute force login attempts
disable_brute_force_login_protection = false

#################################### Snapshots ###########################
[snapshots]
# snapshot sharing options
external_enabled = true
external_snapshot_url = https://snapshots-origin.raintank.io
external_snapshot_name = Publish to snapshot.raintank.io

# remove expired snapshot
snapshot_remove_expired = true

#################################### Dashboards ##################

[dashboards]
# Number dashboard versions to keep (per dashboard). Default: 20, Minimum: 1
versions_to_keep = 20

#################################### Users ###############################
[users]
# disable user signup / registration
allow_sign_up = false

# Allow non admin users to create organizations
allow_org_create = false

# Set to true to automatically assign new users to the default organization (id 1)
auto_assign_org = true

# Set this value to automatically add new users to the provided organization (if auto_assign_org above is set to true)
auto_assign_org_id = 1

# Default role new users will be automatically assigned (if auto_assign_org above is set to true)
auto_assign_org_role = Viewer

# Require email validation before sign up completes
verify_email_enabled = false

# Background text for the user field on the login page
login_hint = email or username

# Default UI theme ("dark" or "light")
default_theme = dark

# External user management
external_manage_link_url =
external_manage_link_name =
external_manage_info =

# Viewers can edit/inspect dashboard settings in the browser. But not save the dashboard.
viewers_can_edit = false

[auth]
# Set to true to disable (hide) the login form, useful if you use OAuth
disable_login_form = false

# Set to true to disable the signout link in the side menu. useful if you use auth.proxy
disable_signout_menu = false

# URL to redirect the user to after sign out
signout_redirect_url =

#################################### Anonymous Auth ######################
[auth.anonymous]
# enable anonymous access
enabled = false

# specify organization name that should be used for unauthenticated users
org_name = Main Org.

# specify role for unauthenticated users
org_role = Viewer

#################################### Github Auth #########################
[auth.github]
enabled = false
allow_sign_up = true
client_id = some_id
client_secret = some_secret
scopes = user:email,read:org
auth_url = https://github.com/login/oauth/authorize
token_url = https://github.com/login/oauth/access_token
api_url = https://api.github.com/user
team_ids =
allowed_organizations =

#################################### GitLab Auth #########################
[auth.gitlab]
enabled = false
allow_sign_up = true
client_id = some_id
client_secret = some_secret
scopes = api
auth_url = https://gitlab.com/oauth/authorize
token_url = https://gitlab.com/oauth/token
api_url = https://gitlab.com/api/v4
allowed_groups =

#################################### Google Auth #########################
[auth.google]
enabled = false
allow_sign_up = true
client_id = some_client_id
client_secret = some_client_secret
scopes = https://www.googleapis.com/auth/userinfo.profile https://www.googleapis.com/auth/userinfo.email
auth_url = https://accounts.google.com/o/oauth2/auth
token_url = https://accounts.google.com/o/oauth2/token
api_url = https://www.googleapis.com/oauth2/v1/userinfo
allowed_domains =
hosted_domain =

#################################### Grafana.com Auth ####################
# legacy key names (so they work in env variables)
[auth.grafananet]
enabled = false
allow_sign_up = true
client_id = some_id
client_secret = some_secret
scopes = user:email
allowed_organizations =

[auth.grafana_com]
enabled = false
allow_sign_up = true
client_id = some_id
client_secret = some_secret
scopes = user:email
allowed_organizations =

#################################### Generic OAuth #######################
[auth.generic_oauth]
name = OAuth
enabled = false
allow_sign_up = true
client_id = some_id
client_secret = some_secret
scopes = user:email
email_attribute_name = email:primary
auth_url =
token_url =
api_url =
team_ids =
allowed_organizations =
tls_skip_verify_insecure = false
tls_client_cert =
tls_client_key =
tls_client_ca =

#################################### Basic Auth ##########################
[auth.basic]
enabled = true

#################################### Auth Proxy ##########################
[auth.proxy]
enabled = false
header_name = X-WEBAUTH-USER
header_property = username
auto_sign_up = true
ldap_sync_ttl = 60
whitelist =

#################################### Auth LDAP ###########################
[auth.ldap]
enabled = false
config_file = /etc/grafana/ldap.toml
allow_sign_up = true

#################################### SMTP / Emailing #####################
[smtp]
enabled = false
host = localhost:25
user =
# If the password contains # or ; you have to wrap it with triple quotes. Ex """#password;"""
password =
cert_file =
key_file =
skip_verify = false
from_address = [email protected]
from_name = Grafana
ehlo_identity =

[emails]
welcome_email_on_sign_up = false
templates_pattern = emails/*.html

#################################### Logging ##########################
[log]
# Either "console", "file", "syslog". Default is console and  file
# Use space to separate multiple modes, e.g. "console file"
mode = console file

# Either "debug", "info", "warn", "error", "critical", default is "info"
level = info

# optional settings to set different levels for specific loggers. Ex filters = sqlstore:debug
filters =

# For "console" mode only
[log.console]
level =

# log line format, valid options are text, console and json
format = console

# For "file" mode only
[log.file]
level =

# log line format, valid options are text, console and json
format = text

# This enables automated log rotate(switch of following options), default is true
log_rotate = true

# Max line number of single file, default is 1000000
max_lines = 1000000

# Max size shift of single file, default is 28 means 1 << 28, 256MB
max_size_shift = 28

# Segment log daily, default is true
daily_rotate = true

# Expired days of log file(delete after max days), default is 7
max_days = 7

[log.syslog]
level =

# log line format, valid options are text, console and json
format = text

# Syslog network type and address. This can be udp, tcp, or unix. If left blank, the default unix endpoints will be used.
network =
address =

# Syslog facility. user, daemon and local0 through local7 are valid.
facility =

# Syslog tag. By default, the process' argv[0] is used.
tag =

#################################### Usage Quotas ########################
[quota]
enabled = false

#### set quotas to -1 to make unlimited. ####
# limit number of users per Org.
org_user = 10

# limit number of dashboards per Org.
org_dashboard = 100

# limit number of data_sources per Org.
org_data_source = 10

# limit number of api_keys per Org.
org_api_key = 10

# limit number of orgs a user can create.
user_org = 10

# Global limit of users.
global_user = -1

# global limit of orgs.
global_org = -1

# global limit of dashboards
global_dashboard = -1

# global limit of api_keys
global_api_key = -1

# global limit on number of logged in users.
global_session = -1

#################################### Alerting ############################
[alerting]
# Disable alerting engine & UI features
enabled = true
# Makes it possible to turn off alert rule execution but alerting UI is visible
execute_alerts = true

# Default setting for new alert rules. Defaults to categorize error and timeouts as alerting. (alerting, keep_state)
error_or_timeout = alerting

# Default setting for how Grafana handles nodata or null values in alerting. (alerting, no_data, keep_state, ok)
nodata_or_nullvalues = no_data

# Alert notifications can include images, but rendering many images at the same time can overload the server
# This limit will protect the server from render overloading and make sure notifications are sent out quickly
concurrent_render_limit = 5

#################################### Explore #############################
[explore]
# Enable the Explore section
enabled = false

#################################### Internal Grafana Metrics ############
# Metrics available at HTTP API Url /metrics
[metrics]
enabled           = true
interval_seconds  = 10

# Send internal Grafana metrics to graphite
[metrics.graphite]
# Enable by setting the address setting (ex localhost:2003)
address =
prefix = prod.grafana.%(instance_name)s.

[grafana_net]
url = https://grafana.com

[grafana_com]
url = https://grafana.com

#################################### Distributed tracing ############
[tracing.jaeger]
# jaeger destination (ex localhost:6831)
address =
# tag that will always be included in when creating new spans. ex (tag1:value1,tag2:value2)
always_included_tag =
# Type specifies the type of the sampler: const, probabilistic, rateLimiting, or remote
sampler_type = const
# jaeger samplerconfig param
# for "const" sampler, 0 or 1 for always false/true respectively
# for "probabilistic" sampler, a probability between 0 and 1
# for "rateLimiting" sampler, the number of spans per second
# for "remote" sampler, param is the same as for "probabilistic"
# and indicates the initial sampling rate before the actual one
# is received from the mothership
sampler_param = 1

#################################### External Image Storage ##############
[external_image_storage]
# You can choose between (s3, webdav, gcs, azure_blob, local)
provider =

[external_image_storage.s3]
bucket_url =
bucket =
region =
path =
access_key =
secret_key =

[external_image_storage.webdav]
url =
username =
password =
public_url =

[external_image_storage.gcs]
key_file =
bucket =
path =

[external_image_storage.azure_blob]
account_name =
account_key =
container_name =

[external_image_storage.local]
# does not require any configuration

[rendering]
# Options to configure external image rendering server like https://github.com/grafana/grafana-image-renderer
server_url =
callback_url =
设置如下内容实现匿名访问:enable=true
#################################### Anonymous Auth ######################
[auth.anonymous]
# enable anonymous access
enabled = false

# specify organization name that should be used for unauthenticated users
org_name = Main Org.

# specify role for unauthenticated users
org_role = Viewer
Docker 运行命令:
docker run -d -p 3300:3000 --name grafana3300 -v D:\DockerWorkspace\grafana\conf\defaults.ini:/usr/share/grafana/conf/defaults.ini grafana/grafana:latest匿名访问界面:

注:如需要管理添加统计图表面板需要使用登录访问模式,只需要改回去然后重启容器就ok了。
第三方集成Grafana
这里使用iframe进行页面嵌套,注意https的主站如果访问的是Http地址会被浏览器阻止访问,因为存在安全和跨域问题。

JSON模板导出

将json数据复制到文件保存即可。
JSON模板导入

复制json模板数据:

点击 “Load”,之后确认导入就可以了。