主要参考了如下博客:然后自己做了一些总结
https://ken.io/note/centos7-influxdb-install-introduction
https://ken.io/note/grafana-quickstart-influxdb-datasource-graph
1、grafana的安装包下载地址:
https://grafana.com/grafana/download
安装完后,执行/home/wuyonghu/grafana/grafana-6.1.3/bin/grafana-server 即可启动,默认启动后端口为3000。通过http://192.168.10.145:3000/即可通过浏览器访问,默认用户名密码为admin/admin
2、influxdb安装:
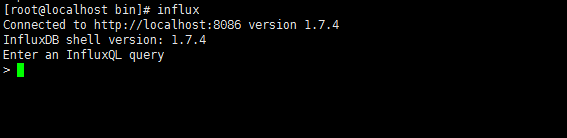
influxdb直接使用yum安装即可,使用service influxdb start启动。
启动完成后,执行即可登录到flux的命令行模式
3、实战:如果作图
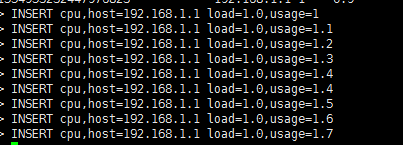
1、在influxdb中执行如下sql:表示在cpu这种表中插入了三个字段。
INSERT cpu,host=192.168.1.1 load=0.2,usage=0.9
INSERT cpu,host=192.168.1.1 load=0.3,usage=0.9
INSERT cpu,host=192.168.1.1 load=0.4,usage=0.9
INSERT cpu,host=192.168.1.1 load=0.5,usage=0.9
INSERT cpu,host=192.168.1.1 load=0.6,usage=0.9
INSERT cpu,host=192.168.1.1 load=0.7,usage=0.9
INSERT cpu,host=192.168.1.1 load=0.8,usage=0.9
INSERT cpu,host=192.168.1.1 load=0.9,usage=0.9
INSERT cpu,host=192.168.1.1 load=1.0,usage=0.9

2、在influxdb中有数据后,然后在grafana中添加一个面板:

然后在面板的sql中去编写sql。


编写完成后保存,这里就能看到192.168.1.1的usage字段的图了。

然后重新在Influxdb中加入数据,就能看到图形的变化了。