完成一套精准,漂亮图形化监控系统从这里开始第一步
Telegraf是收集和报告指标和数据的代理
它是TICK堆栈的一部分,是一个用于收集和报告指标的插件驱动的服务器代理。Telegraf拥有插件或集成功能,可直接从运行的系统获取各种指标,从第三方API获取指标,甚至通过StatsD和Kafka消费者服务来收听指标。它还具有输出插件,可将指标发送到各种其他数据存储,服务和消息队列,包括InfluxDB,Graphite,OpenTSDB,Datadog,Librato,Kafka,MQTT,NSQ等等。

Spring Boot Actuator
Spring Boot Actuator包含一个带“metrics”和“gauge”支持的度量服务。“量表”记录单个值; '计数器'记录增量(增量或减量)。Spring Boot Actuator还提供了一个PublicMetrics可以实现的 界面,用于公开您无法通过这两种机制之一记录的指标。看SystemPublicMetrics 一个例子。
将你的springboot项目中依赖Spring Boot Actuator 的包,启动之后会发现控制台打出的mapped变得很多了,例如/env、/health、/info等等的信息,恭喜你已经成功使用了metric对程序进行了简单的监控了,在浏览器中输入本地的ip项目访问地址如:http://localhost:8080/metrics,就会出现如下的数据
|
1
2
3
4
5
6
7
8
9
10
11
12
13
14
15
16
17
18
19
20
21
22
23
24
25
26
27
28
29
30
31
|
{
"counter.status.200.root"
: 20,
"counter.status.200.metrics"
: 3,
"counter.status.200.star-star"
: 5,
"counter.status.401.root"
: 4,
"gauge.response.star-star"
: 6,
"gauge.response.root"
: 2,
"gauge.response.metrics"
: 3,
"classes"
: 5808,
"classes.loaded"
: 5808,
"classes.unloaded"
: 0,
"heap"
: 3728384,
"heap.committed"
: 986624,
"heap.init"
: 262144,
"heap.used"
: 52765,
"nonheap"
: 0,
"nonheap.committed"
: 77568,
"nonheap.init"
: 2496,
"nonheap.used"
: 75826,
"mem"
: 986624,
"mem.free"
: 933858,
"processors"
: 8,
"threads"
: 15,
"threads.daemon"
: 11,
"threads.peak"
: 15,
"threads.totalStarted"
: 42,
"uptime"
: 494836,
"instance.uptime"
: 489782,
"datasource.primary.active"
: 5,
"datasource.primary.usage"
: 0.25
}
|
管理员功能
通过指定spring.application.admin.enabled属性可以为应用程序启用与管理相关的功能 。这暴露 SpringApplicationAdminMXBean 了平台上MBeanServer。您可以使用此功能远程管理您的Spring Boot应用程序。这对于任何服务包装器实现也是有用的。

引入spring-boot-admin依赖
<dependency>
    <groupId>de.codecentric</groupId>
    <artifactId>spring-boot-admin-server</artifactId>
    <version>1.4.0</version>
</dependency>

<dependency>
    <groupId>de.codecentric</groupId>
    <artifactId>spring-boot-admin-server-ui</artifactId>
    <version>1.4.0</version>
</dependency>
如果您想知道应用程序在哪个HTTP端口上运行,请使用密钥获取该属性local.server.port。
当启用此功能时要小心,因为MBean公开了关闭应用程序的方法。
使用Jolokia进行JMX over HTTP
Jolokia是一个JMX-HTTP桥梁,它提供了访问JMX bean的另一种方法。要使用Jolokia,只需添加依赖项即可org.jolokia:jolokia-core。例如,使用Maven你可以添加以下内容:
<dependency>
    <groupId> org.jolokia </ groupId>
    <artifactId> jolokia-core </ artifactId>
 </ dependency>
在application.yaml后者application.properties中配置响应的配置
jolokia.config.debug=true
endpoints.jolokia.enabled=true
#endpoints.jolokia.sensitive=true
endpoints.jolokia.path=/jolokia
环境搭建
下载Telegraf、influxdb 、grafana
influxDB的安装
wget https://dl.influxdata.com/influxdb/releases/influxdb-0.13.0.x86_64.rpm
sudo yum localinstall influxdb-0.13.0.x86_64.rpm
sudo service influxdb start
grafana的安装
wget https://dl.grafana.com/oss/release/grafana-5.4.3-1.x86_64.rpm
sudo yum localinstall grafana-5.4.3-1.x86_64.rpm
systemctl start grafana-server
Telegraf的安装
wget https://dl.influxdata.com/telegraf/releases/telegraf-1.7.4-1.x86_64.rpm
sudo yum localinstall telegraf-1.7.4-1.x86_64.rpm
systemctl start telegraf
安装完成后,开始配置:
3.创建 Influxdb 用户和数据库
[root@localhost apm]# influx
Visit https://enterprise.influxdata.com to register for updates, InfluxDB server management, and monitoring.
Connected to http://localhost:8086 version 0.13.0
InfluxDB shell version: 0.13.0
> create user "telegraf" with password 'password'
> show users;
user        admin
telegraf    false

> create database telegraf
> show databases
name: databases
---------------
name
_internal
telegraf
> exit
4.配置Telegraf
[root@localhost apm]# vim /etc/telegraf/telegraf.conf
   ## 修改内容如下:
   [[outputs.influxdb]]
     urls = ["http://localhost:8086"] # required
     database = "telegraf" # required
     retention_policy = ""
     precision = "s"
     timeout = "5s"
     username = "telegraf"
     password = "password"
[root@localhost apm]# systemctl restart telegraf
打开grafana的控制台:http://ip:3000
从左边的设置菜单栏找到数据源配置项,添加上面的库信息,结果如下:
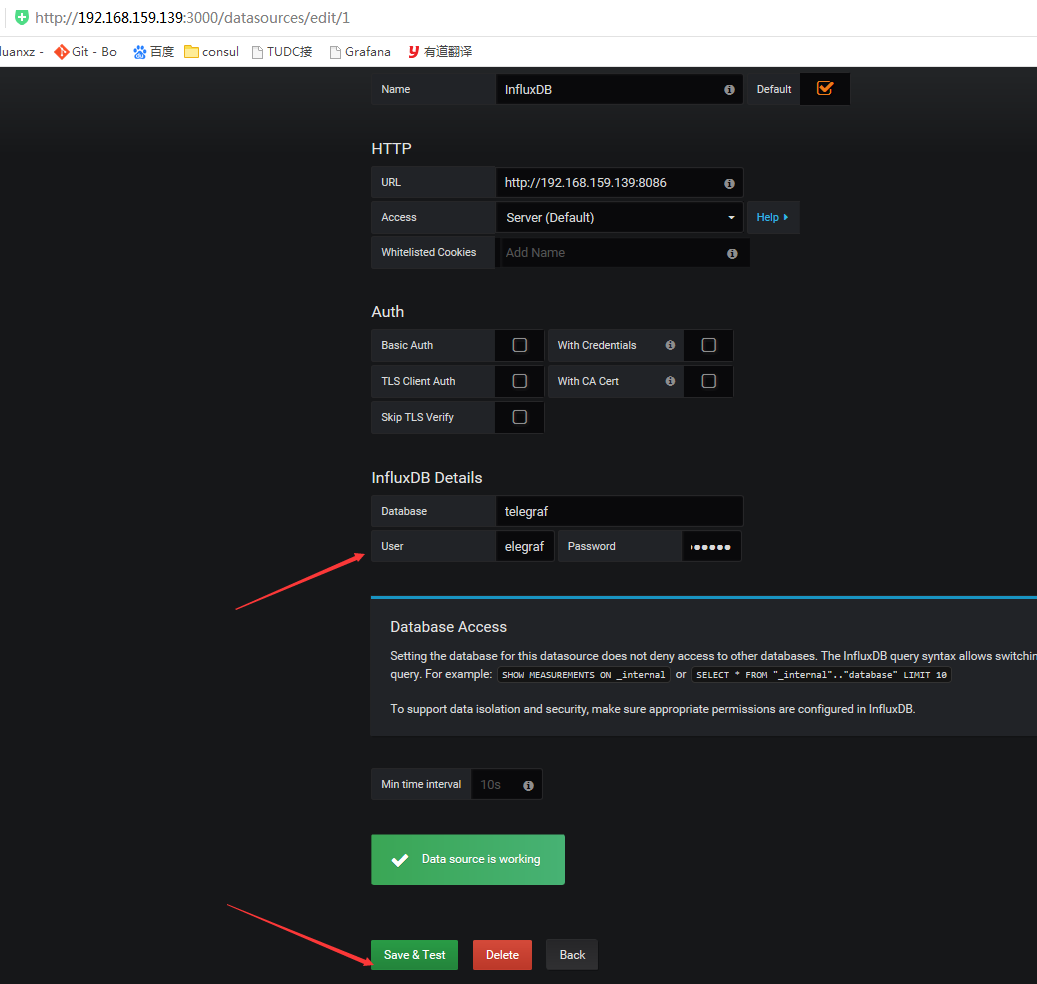
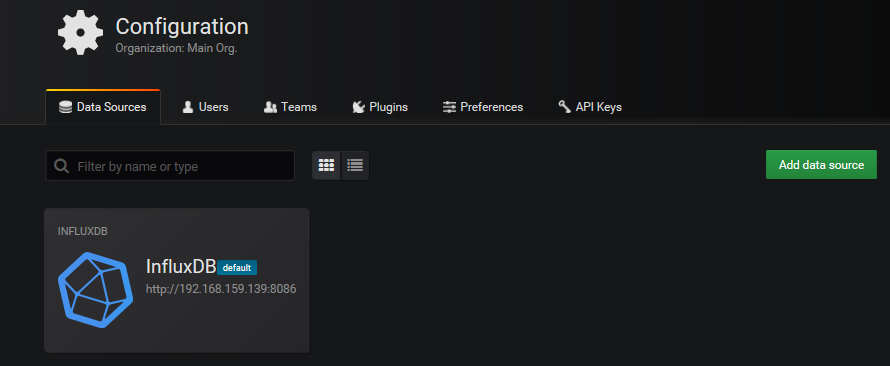
1 Influxdb配置
修改influxdb.conf,设置日志文件目录:
#cd 到安装解压的修改influxdb.conf
[admin]
# Determines whether the admin service is enabled.
enabled = true
# The default bind address used by the admin service.
bind-address = ":8083"
其他配置都是默认好的,不用修改,如果版本下载不一样可能需要修改,不妨给我留言,我会及时回复的
2启动
通过cmd命令窗口,切换到influxdb安装目录,执行如下命令:
influxd -config influxdb.conf
通过cmd命令窗口,切换到Telegraf安装目录,执行如下命令:
telegraf -config telegraf.conf
切换到Grafana安装目录中的bin目录下,双击grafana-server.exe启动程序
访问http://locahost:8090,这是可以配置的端口号,可以访问了:
使用:
访问http://localhost:8086,使用admin/admin登录本机Grafana,新建influxdb数据源:
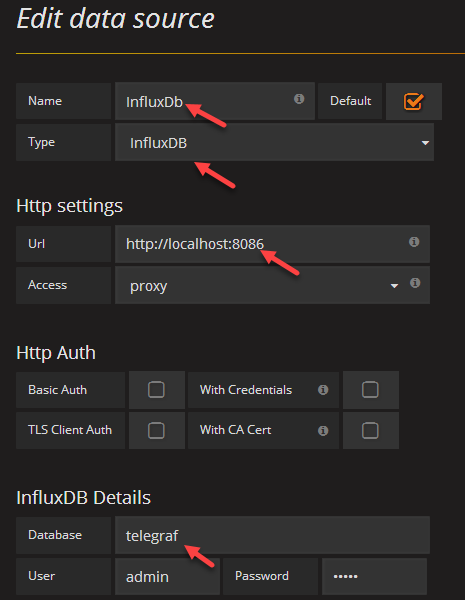
【注意】Telegraf启动后,向InfluxDb中上报数据时,会默认创建一个telegraf数据库,所以上面我们配置DataBase是telegraf
点击new创建一个Dashboards
配置编辑会出来可配置页面:
点击General:配置基本的图表信息
点击metrics,配置收集到的收据信息,实际就是写sql查询,不同数据库数据sql书写方式不同
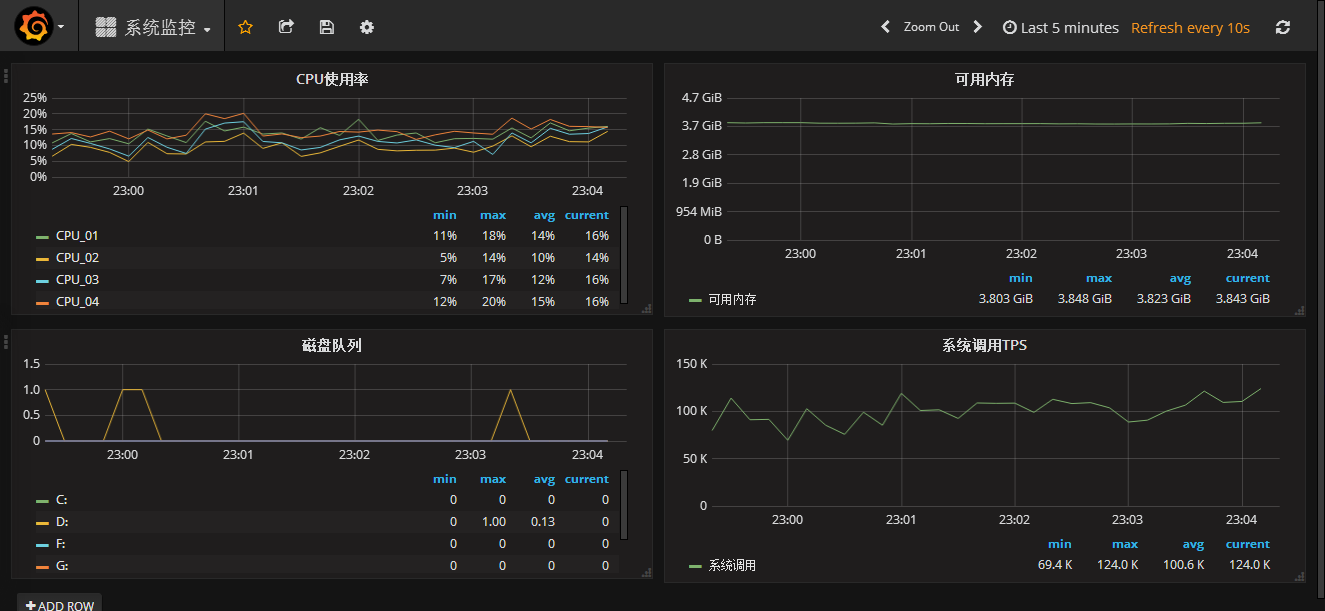
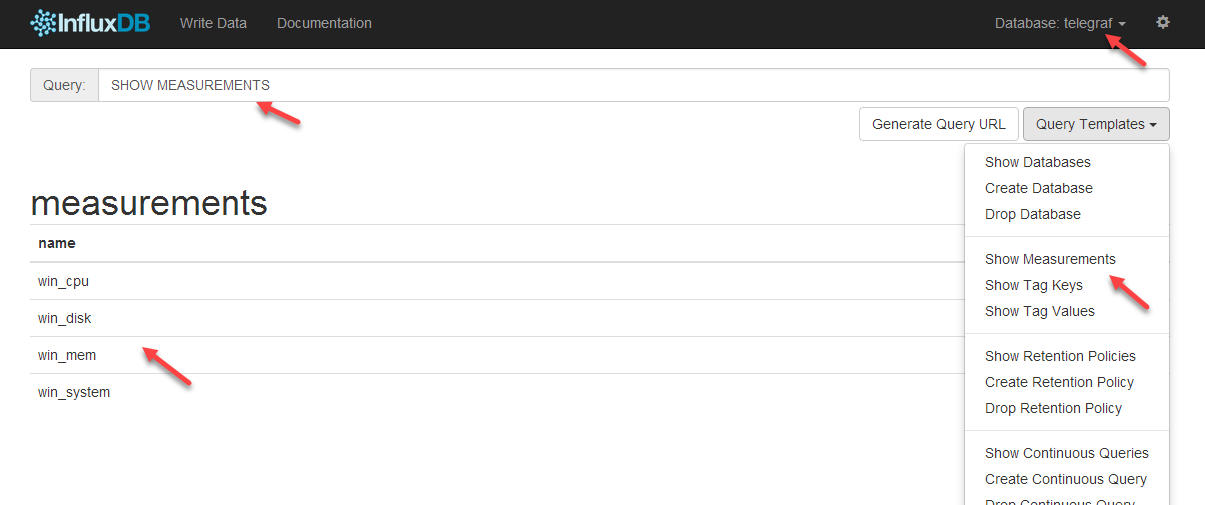
查看http://localhost:8083,可以发现telegraf库中,默认有4个Measurements(表):
配置Grafana中的面板完成后,这样一个简易的本机监控系统就搭建完了: