Telegraf 是一个用 Go 编写的代理程序,可收集系统和服务的统计数据,并写入到 InfluxDB 数据库,Telegraf 具有内存占用小的特点,通过插件系统开发人员可轻松添加支持其他
服务的扩展。
所以,我们通过配置inputs来实现对spring-boot应用的监控。
下载地址:https://cloud.influxdata.com/downloads
linux下安装:
①cd /usr/local
②wget https://dl.influxdata.com/telegraf/releases/telegraf-1.2.1.x86_64.rpm
③sudo yum localinstall telegraf-1.2.1.x86_64.rpm
配置:
vi /etc/telegraf/telegraf.conf①配置数据输入源,释放一些基本的服务:
[[inputs.cpu]]
  ## Whether to report per-cpu stats or not
  percpu = true
  ## Whether to report total system cpu stats or not
  totalcpu = true
  ## If true, collect raw CPU time metrics.
  collect_cpu_time = false

  [[inputs.mem]]
  # no configuration

   [[inputs.zookeeper]]
#   ## An array of address to gather stats about. Specify an ip or hostname
#   ## with port. ie localhost:2181, 10.0.0.1:2181, etc.
#
#   ## If no servers are specified, then localhost is used as the host.
#   ## If no port is specified, 2181 is used
#   servers = [":2181"]
servers = ["172.21.121.53:2181","172.21.121.54:2181","172.21.121.55:2181"]
还支持:kafka、MQTT、redis等服务,
# # Read JMX metrics through Jolokia
 [[inputs.jolokia]]
#   ## This is the context root used to compose the jolokia url
#   ## NOTE that Jolokia requires a trailing slash at the end of the context root
#   ## NOTE that your jolokia security policy must allow for POST requests.
   context = "/jolokia/"
#
#   ## This specifies the mode used
#   # mode = "proxy"
#   #
#   ## When in proxy mode this section is used to specify further
#   ## proxy address configurations.
#   ## Remember to change host address to fit your environment.
#   # [inputs.jolokia.proxy]
#   #   host = "127.0.0.1"
#   #   port = "8080"
#
#   ## Optional http timeouts
#   ##
#   ## response_header_timeout, if non-zero, specifies the amount of time to wait
#   ## for a server's response headers after fully writing the request.
#   # response_header_timeout = "3s"
#   ##
#   ## client_timeout specifies a time limit for requests made by this client.
#   ## Includes connection time, any redirects, and reading the response body.
#   # client_timeout = "4s"
#
#   ## List of servers exposing jolokia read service
   [[inputs.jolokia.servers]]#这里指向的就是jolokia所监控的应用,技术这东西融会贯通,构建spring boot的helloWorld
   #http://projects.spring.io/spring-boot/#quick-start,具体的一些框架整合的配置请查阅官方文档
     name = "server-001"
     host = "127.0.0.1"
     port = "8089"
#     # username = "myuser"
#     # password = "mypassword"
#
#   ## List of metrics collected on above servers
#   ## Each metric consists in a name, a jmx path and either
#   ## a pass or drop slice attribute.
#   ##?This collect all heap memory usage metrics.
   [[inputs.jolokia.metrics]]#这里就是一些监控的参数了:内存使用、类加载,线程等
     name = "heap_memory_usage"
     mbean  = "java.lang:type=Memory"
     attribute = "HeapMemoryUsage"
#
#   ##?This collect thread counts metrics.
   [[inputs.jolokia.metrics]]
     name = "thread_count"
     mbean  = "java.lang:type=Threading"
     attribute = "TotalStartedThreadCount,ThreadCount,DaemonThreadCount,PeakThreadCount"
#
#   ##?This collect number of class loaded/unloaded counts metrics.
   [[inputs.jolokia.metrics]]
     name = "class_count"
     mbean  = "java.lang:type=ClassLoading"
     attribute = "LoadedClassCount,UnloadedClassCount,TotalLoadedClassCount"
②配置数据输出源:
#这里的配置指向了数据存储:influxdb数据库
[[outputs.influxdb]]
  ## The full HTTP or UDP endpoint URL for your InfluxDB instance.
  ## Multiple urls can be specified as part of the same cluster,
  ## this means that only ONE of the urls will be written to each interval.
  # urls = ["udp://localhost:8089"] # UDP endpoint example
  urls = ["http://172.21.121.54:8086"] # required
  ## The target database for metrics (telegraf will create it if not exists).
  database = "telegraf" # required

  ## Retention policy to write to. Empty string writes to the default rp.
  retention_policy = ""
  ## Write consistency (clusters only), can be: "any", "one", "quorum", "all"
  write_consistency = "any"

  ## Write timeout (for the InfluxDB client), formatted as a string.
  ## If not provided, will default to 5s. 0s means no timeout (not recommended).
  timeout = "5s"
username = "admin"
password = "admin"
  # username = "telegraf"
  # password = "metricsmetricsmetricsmetrics"
  ## Set the user agent for HTTP POSTs (can be useful for log differentiation)
  # user_agent = "telegraf"
  ## Set UDP payload size, defaults to InfluxDB UDP Client default (512 bytes)
  # udp_payload = 512

  ## Optional SSL Config
  # ssl_ca = "/etc/telegraf/ca.pem"
  # ssl_cert = "/etc/telegraf/cert.pem"
  # ssl_key = "/etc/telegraf/key.pem"
  ## Use SSL but skip chain & host verification
  # insecure_skip_verify = false
这里的配置信息是最后调试成功的配置信息,正常来讲,telegraf是最后来配置。
启动:
sudo service telegraf start [stop停止、status、restart]
二、数据存储:influxdb
InfluxDB 是一个开源分布式时序、事件和指标数据库。使用 Go 语言编写,无需外部依赖。其设计目标是实现分布式和水平伸缩扩展。
它有三大特性:
1. Time Series (时间序列):你可以使用与时间有关的相关函数(如最大,最小,求和等)
2. Metrics(度量):你可以实时对大量数据进行计算
3. Eevents(事件):它支持任意的事件数据
下载地址:https://cloud.influxdata.com/downloads
linux下安装:
注意:influxdb的安装依赖3个端口:8083、8086、8088,所以安装之前,先检查端口是否被占用:netstat -apn | grep 8080
①cd /usr/local
②wget https://dl.influxdata.com/influxdb/releases/influxdb-0.13.0.x86_64.rpm
(这个版本有后台管理,1.1版本后。删除了后台管理功能,你也可以下载其他版本)
③sudo yum localinstall influxdb-0.13.0.x86_64.rpm
④vi /etc/influxdb/influxdb.conf
可以配置一下端口(8083和8086)
启动:
sudo service influxdb start [stop停止、status、restart]访问:
访问http://localhost:8083来访问influxdb的web页面;
三、配置spring boot应用
引入spring-boot-admin依赖
<dependency>
	<groupId>de.codecentric</groupId>
	<artifactId>spring-boot-admin-server</artifactId>
	<version>1.4.0</version>
</dependency>

<dependency>
	<groupId>de.codecentric</groupId>
	<artifactId>spring-boot-admin-server-ui</artifactId>
	<version>1.4.0</version>
</dependency>
引入actuator依赖
<dependency>
	<groupId>org.springframework.boot</groupId>
	<artifactId>spring-boot-starter-actuator</artifactId>
	<version>1.4.3.RELEASE</version>
</dependency>

引入jolokia依赖
<dependency>
	<groupId>org.jolokia</groupId>
	<artifactId>jolokia-core</artifactId>
	<version>1.3.5</version>
</dependency>
配置application.properties:
增加
jolokia.config.debug=true
endpoints.jolokia.enabled=true
#endpoints.jolokia.sensitive=true
endpoints.jolokia.path=/jolokia
endpoints: enabled: true jmx: enabled: true jolokia: enabled: true management: security: enabled: false
最后启动,并访问http://172.21.121.54:8089/jolokia/read/org.springframework.boot:name=metricsEndpoint,type=Endpoint/Data
若有数据返回,则整合成功;
四、数据展示:grafana
Grafana是一个纯粹的html/js应用,访问InfluxDB时不会有跨域访问的限制。
只要配置好数据源为InfluxDB之后就可以,剩下的工作就是配置图表。Grafana 功能非常强大。
这个我安装的是windows版。
下载地址:https://grafana.com/grafana/download
配置:
复制conf文件夹下sqmple.int,命名为custom.ini
修改custom.ini文件
①配置日志文件保存路径:logs = /var/log/grafana 这个路径自定义
②配置端口号:http_port = 8091
③配置数据库:三种选择,mysql,postgres,sqlite3
url = mysql://root:[email protected]:3306/test
启动:运行grafana-server
访问:http://localhost:8091,进行展示数据配置
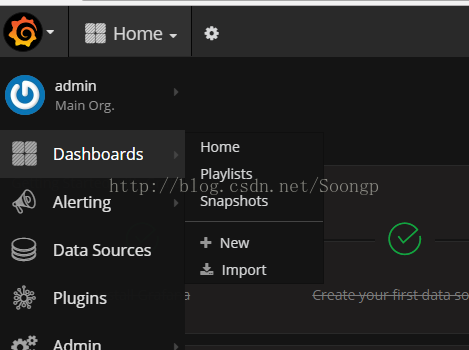
点击new创建一个Dashboards
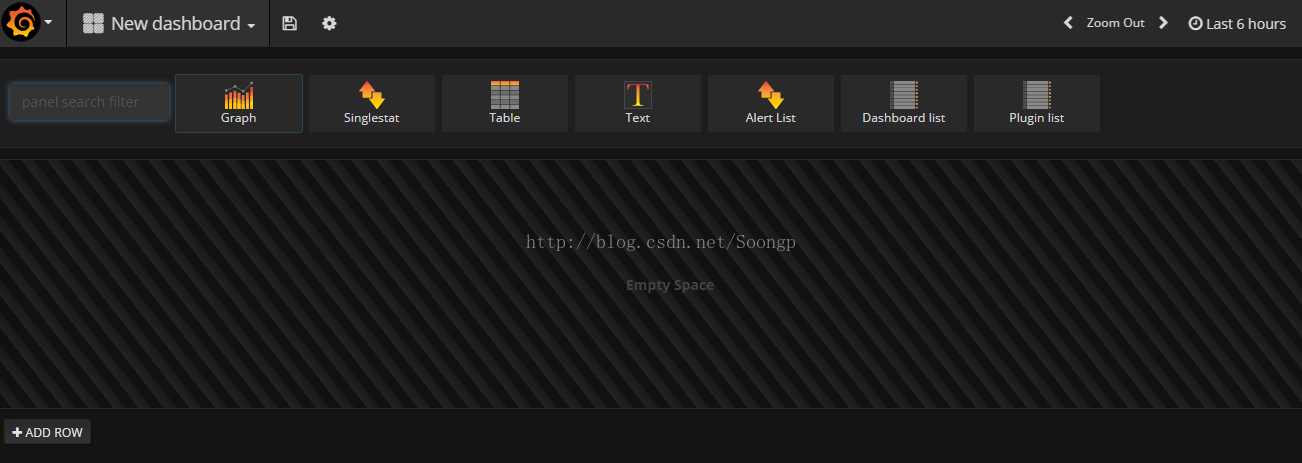
选择Graph
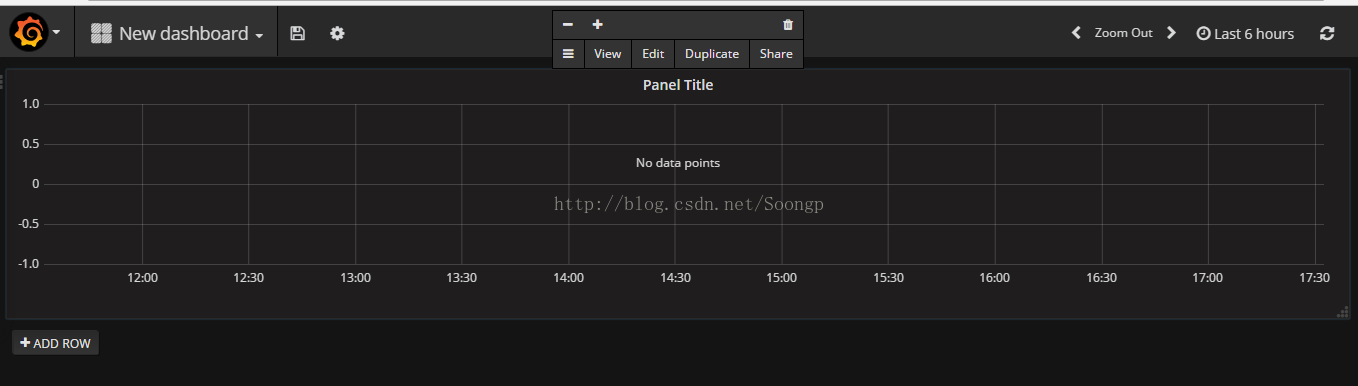
点击标题Panel Title,点击弹出框中的Edit,对这个图表进行配置

点击General

配置图表基本信息,然后点击保存。点击Metrics

点击Axes

点击display
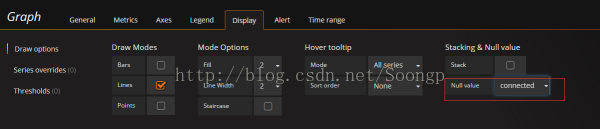
选择connected
最后保存;
点击右上角时间:

时间范围是5分钟,每5秒刷新一次数据,最终结果:
