目标:
- 基础绘图
- 绘图的物件
一、基础绘图
plot()函数:
- plot(x, y):根据坐标(x,y)画出图形
- plot(y):只给出y,这样画图的时候,x轴就是x=[1...n], n = length(y)
- 但我们想要在画布上使用两个plot()时。第二个图形会覆盖第一个
hold on/off:
- 作用:在一个画布上,画多个图形
>> hold on;
>> plot(cos(0:pi/20:2*pi));
>> plot(sin(0:pi/20:2*pi));
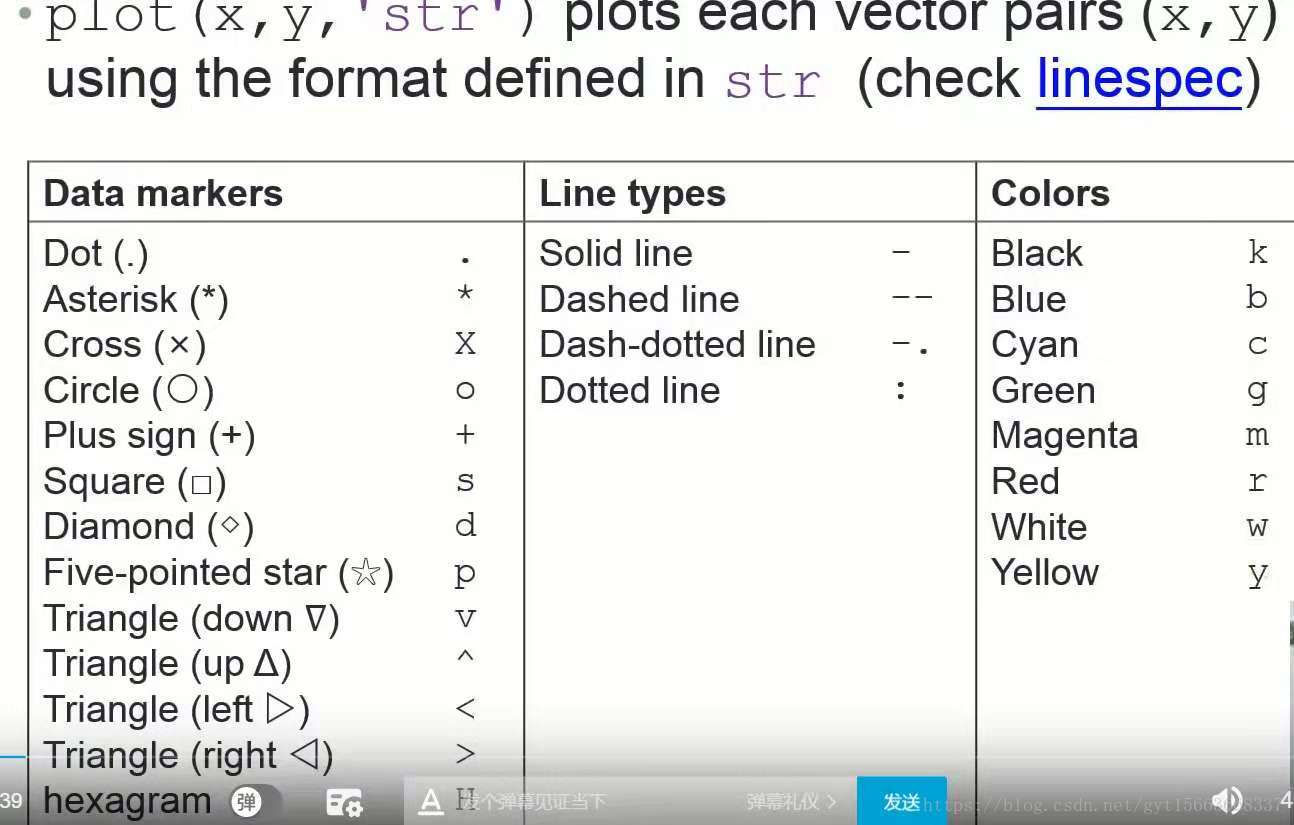
>> hold off;画图风格参数:
legend():添加图例
x = 0:0.5:4*pi;
y = sin(x);
h = cos(x);
w = 1./(1+exp(-x));
g = (1/(2*pi*2)^0.5).*exp((-1.*(x-2*pi).^2)./(2*2^2));
plot(x,y,'bd-',x,h,'gp:',x,w,'ro-',x,g,'c^-');
% 添加图例
legend('sin(x)','cos(x)','Sigmoid','Gauss function');
title() and xlabel() and ylabel():添加图像标题与x轴和y轴标签
x = 0:0.1:2*pi;
y1 = sin(x);
y2 = exp(-x);
plot(x, y1, '--*', x, y2, ':o');
% 添加x轴y轴标签
xlabel('t = 0 to 2\pi');
ylabel('values of sin(t) and e^{-x}');
% 添加标题
title('Function Plots of sin(t) and e^{-x}');
legend('sin(t)', 'e^{-x}');
text() and annotation():在图形上显示文本和画箭头
x = linspace(0,3);
y = x.^2.*sin(x);
plot(x,y);
line([2,2], [0,2^2*sin(2)]);
str = '$$ \int_{0}^{2} x^2\sin(x) dx $$';
% 显示出积分公式
text(0.25, 2.5, str, 'Interpreter','latex');
% 显示箭头
annotation('arrow', 'X', [0.32,0.5], 'Y', [0.6,0.4]);
二、绘图物件
matlab画图包含的结构:
-
Figure object:画布
-
Axes object:坐标轴
-
Line object:图形
-
Text object:文本
-
Surface object
-
...
-
Figure Adjustment:
几个特性:
-
字体
-
字体大小
-
线的宽度
-
坐标限制
-
tick positon(刻度位置)
-
tick labe
Modifying Properties of An Object(修改绘图物件)
策咯:
-
找到物件的handle,每一个object都有一个handle
-
读取或改变物件的特性
1.identifying the handle of an object:获取对象的handle
-
Upon creation
-
h = plot(x,y); 直接获取画线的handle
-
-
Utility functions:
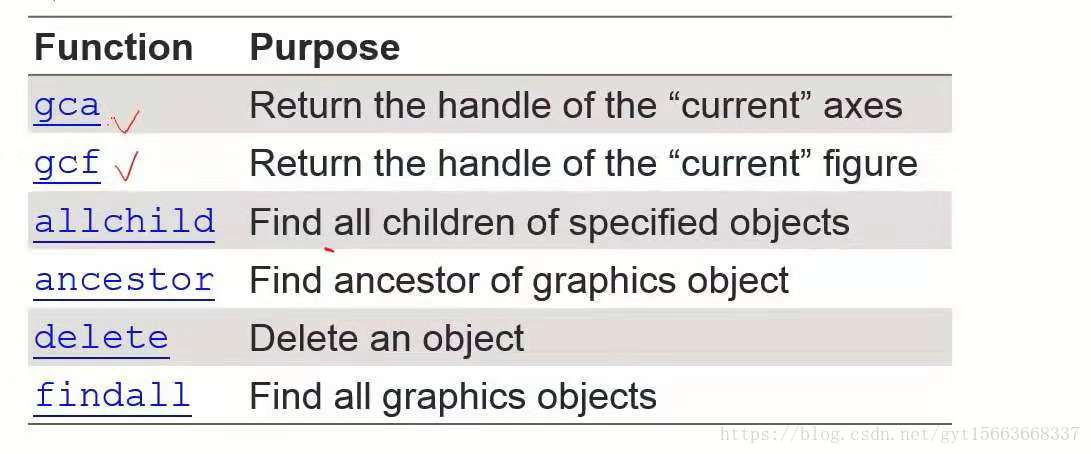
2.Fetching or Modigying Properties:取出或者改变物件
-
get object properties(获取物件的特性):get()
-
setting axes limits(设置坐标轴的限制):set()
-
set(gca, 'XLim', [0, 2*pi]);
-
-
setting font and tick of axes(改变坐标轴的字体大小,刻度)
-
set(gca, 'FontSize', 25);
-
set(gca, 'XTick', 0:pi/2:2*pi);
-
set(gca, 'XTickLabel', 0:90:360);
-
-
Line Specification(线的特性)
-
line style and width(线的风格和宽度)
-
set(h,'LineStyle','-.','LineWidth',7.0,'Color','g');
-
-
-
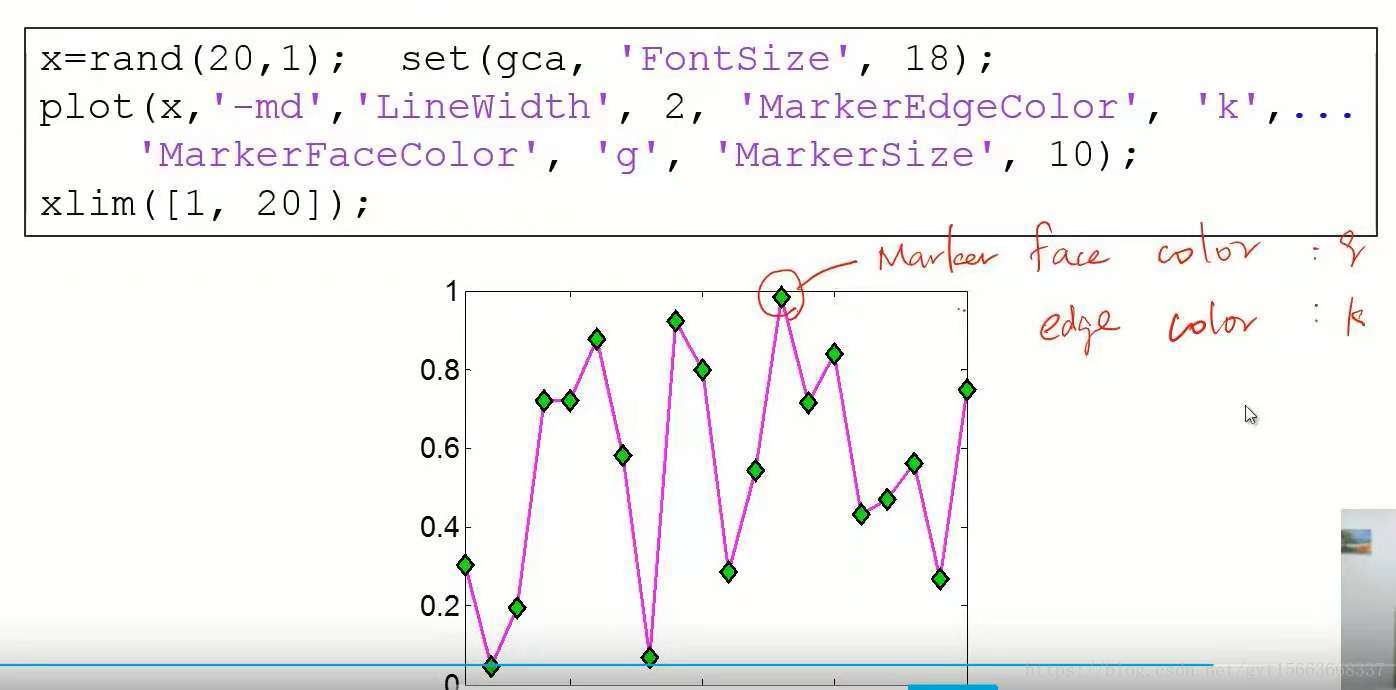
Marker specification(线上标记的特性)
-
face and edge colors of the markder
-
Multiple Figures(多个画布):
-
呼叫figure创建一个figure窗口。
-
当使用gcf 获取handel时要小心,存在多个figures。
x = -10:0.1:10;
y1 = x.^2 - 8;
y2 = exp(x);
% 呼叫figure,画出y1
figure, plot(x,y1);
% 呼叫figure,画出y2
figure, plot(x,y2);-
Figure Position and Size
-
figure('Position',[left,bottom,width,height]);
-
Several Plots in one Figure:
-
several small plots "in a figure"
-
subplot(m,n,1); % 在一个figure上画,m行n列个图,1代表第几个图
-
t = 0:0.1:2*pi;
x = 3*cos(t);
y = sin(t);
subplot(2,2,1);plot(x,y); axis normal
subplot(2,2,2);plot(x,y); axis square
subplot(2,2,3);plot(x,y); axis equal  % 正常图,x和y的刻度一样
subplot(2,2,4);plot(x,y); axis equal tight
操作figure的几个函数:注意当多个图形时,只操作最后一个

Saving Figures into Files :
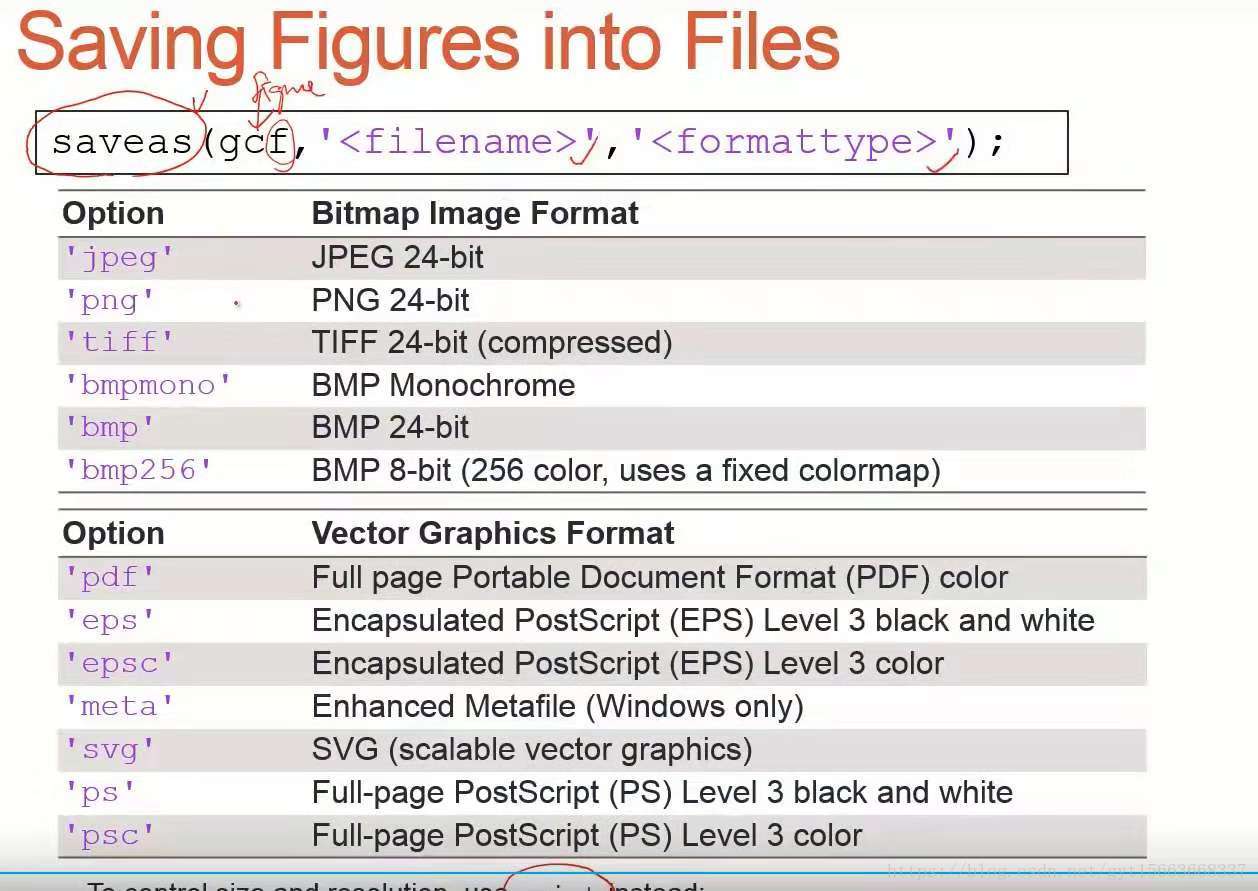
如果想到达到高解析度,则使用print函数储存文件