1. Introduction:
Gibbs Sampling is a MCMC method to draw samples from a potentially complicated, high dimensional distribution, where analytically, it’s hard to draw samples from it. The usual suspect would be those nasty integrals when computing the normalizing constant of the distribution, especially in Bayesian inference.
Gibbs Sampler can draw samples from any distribution, provided you have all of the conditional distributions of the joint distribution analytically.
2. Psudo-code:
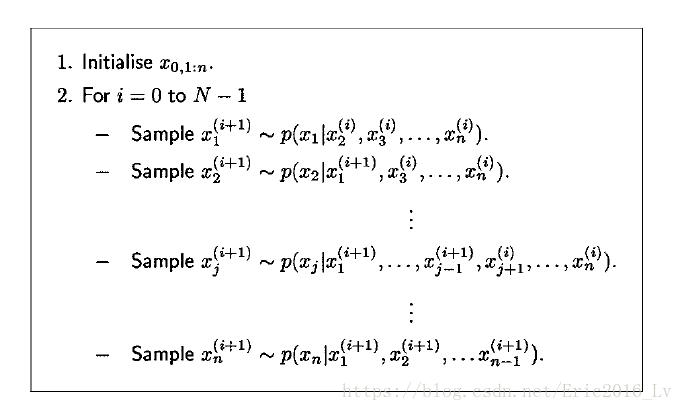
3. Problem:
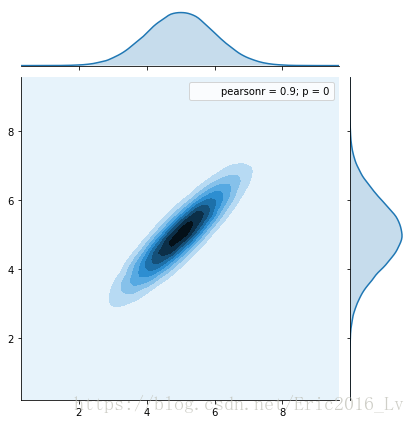
To use Gibbs Sampler to draw 10000 samples from a Bivariate Gaussian Distribution with
and
4. Start up:
Multivariate Gaussian Conditional distribution derivation can be found in the following links:
1.[html]: https://blog.csdn.net/eric2016_lv/article/details/79753908
2.[pdf]: https://download.csdn.net/download/eric2016_lv/10317299
3.[html]:http://fourier.eng.hmc.edu/e161/lectures/gaussianprocess/node7.html
5. Python Code:
# -*- coding: utf-8 -*-
"""
Created on Fri Mar 30 10:49:33 2018
E-mail = [email protected]
@author: DidiLv
"""
import numpy as np
import seaborn as sns
def p_x_given_y(y, mus, sigmas):
mu = mus[0] + sigmas[1, 0] / sigmas[0, 0] * (y - mus[1])
sigma = sigmas[0, 0] - sigmas[1, 0] / sigmas[1, 1] * sigmas[1, 0]
return np.random.normal(mu, sigma)
def p_y_given_x(x, mus, sigmas):
mu = mus[1] + sigmas[0, 1] / sigmas[1, 1] * (x - mus[0])
sigma = sigmas[1, 1] - sigmas[0, 1] / sigmas[0, 0] * sigmas[0, 1]
return np.random.normal(mu, sigma)
def gibbs_sampling(mus, sigmas, iter=int(5e3)):
samples = np.zeros((iter, 2))
y = np.random.rand() * 10
for i in range(iter):
x = p_x_given_y(y, mus, sigmas)
y = p_y_given_x(x, mus, sigmas)
samples[i, :] = [x, y]
return samples
if __name__ == '__main__':
mus = np.array([5, 5])
sigmas = np.array([[1, .9], [.9, 1]])
# plot the ground truth
x,y = np.random.multivariate_normal(mus, sigmas, int(1e5)).T
sns.jointplot(x,y,kind="kde")
# plot the Gibbs sampling results
samples = gibbs_sampling(mus, sigmas)
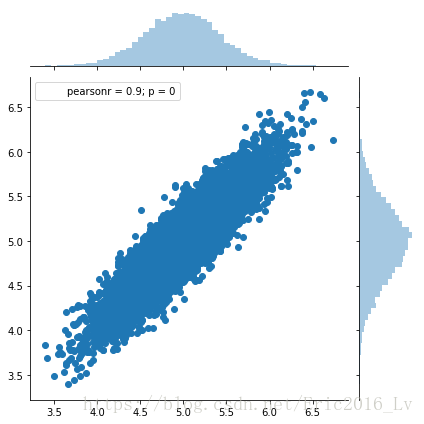
sns.jointplot(samples[:, 0], samples[:, 1])6. Results:
1. Ground Truth:
2. Gibbs Sampling:
7. Acknowledgement:
Main contents and most of code are from
https://wiseodd.github.io/techblog/2015/10/09/gibbs-sampling/
Reference:
[pdf]: Introduction to MCMC for Machine Learning.