前言
绘制实验结果时,很多时候默认设置得到的图形,并不能满足我们的需求。如果我们希望绘制出来的图形更加骚一点,更好看一点,我们怎么做呢。接下来我将介绍绘图时设置横纵坐标的表示方式,包括使用科学计数法和用公式表示方法的。
- 科学计数表示的纵坐标

导入必要包
导入必要的包,其中FuncFormatter就是设置坐标格式的函数
import seaborn as sns
import matplotlib.pyplot as plt
from matplotlib.ticker import FuncFormatter   ### 今天的主角
import numpy as np
sns.set_style('whitegrid')    ###可以设置白色网格风格使图形更漂亮
未设置坐标格式
下面为未设置坐标格式的代码,我们可以得到相应的实验结果。
A = np.random.randint(10000, 50000, size=(1000))
f, ax = plt.subplots(1, 1)
ax.scatter(range(len(A)), A , color='k', label='A', marker='o', s=10)
ax.set_xlim([0, 1000])
plt.show()
- 结果

科学计数表示
下面代码的核心主要在FuncFormatter, 可以看出formatnum包含两个参数,x就是我们的坐标值,pos是位置。return返回的字符串就是我们想要的表示形式。如果了解过latex,可以看出公式的部分主要和latex的表示方式相近,$$钱号里面写我们要表达的格式, $10^{4} $就是我们要的指数表示。 $ .1f% $是系数,其实去除钱号也行,可是会导致字体大小不一样,所以这里就没有去除。
- 这里只写了y坐标的表示,控制x也一样
A = np.random.randint(10000, 50000, size=(1000))
f, ax = plt.subplots(1, 1)
ax.scatter(range(len(A)), A , color='k', label='A', marker='o', s=10)
ax.set_xlim([0, 1000])
def formatnum(x, pos):
    return '$%.1f$x$10^{4}$' % (x/10000)
formatter = FuncFormatter(formatnum)
ax.yaxis.set_major_formatter(formatter)
ax.set_xlabel('Episode')
ax.set_ylabel('Waiting time')
plt.show()
- 结果

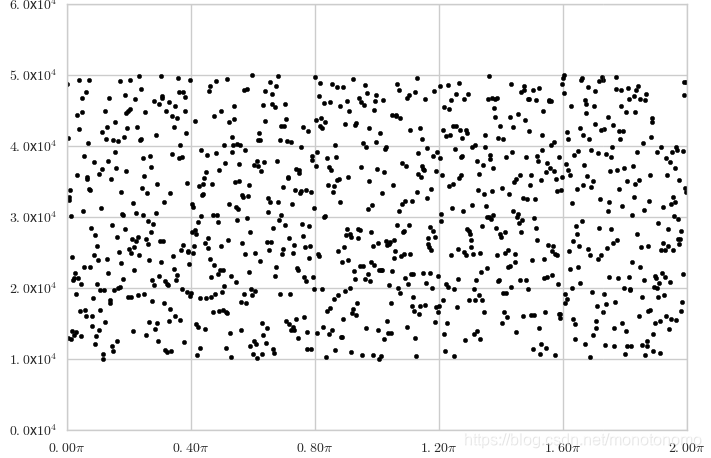
- 公式表示
A = np.random.randint(10000, 50000, size=(1000))
f, ax = plt.subplots(1, 1)
ax.scatter(range(len(A)), A , color='k', label='A', marker='o', s=10)
ax.set_xlim([0, 1000])
def formatnum(x, pos):
    return '$%.1f$x$10^{4}$' % (x/10000)
def formatnum_x(x, pos):
    return '$%.2f \pi$' % (x/500)
formatter1 = FuncFormatter(formatnum)
formatter2 = FuncFormatter(formatnum_x)
ax.yaxis.set_major_formatter(formatter1)
ax.xaxis.set_major_formatter(formatter2)
plt.show()
- 结果