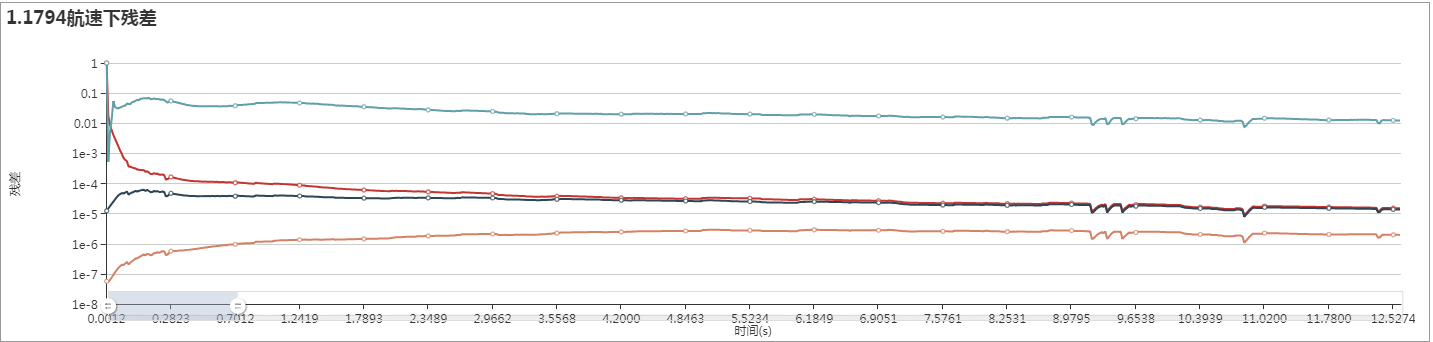
最近做项目使用echart画图,发现纵坐标的刻度太大或太小的情况,导致页面十分难看,甚至出现遮挡的情况,所以想办法用科学计数法表示
代码如下:
            var option = {
                title: Echart.title,
                legend: Echart.legend,
                                dataZoom: [
//                                {
//                                    left:20,
//                                    type: 'slider',
//                                    yAxisIndex: 0,
//                                    filterMode: 'empty',
//
//                                },
                                {
                                    type: 'inside',
                                    start: 0,
                                    end: 10
                                }, {
                                    bottom:20,
                                    start: 0,
                                    end: 10,
                                    handleIcon: 'M10.7,11.9v-1.3H9.3v1.3c-4.9,0.3-8.8,4.4-8.8,9.4c0,5,3.9,9.1,8.8,9.4v1.3h1.3v-1.3c4.9-0.3,8.8-4.4,8.8-9.4C19.5,16.3,15.6,12.2,10.7,11.9z M13.3,24.4H6.7V23h6.6V24.4z M13.3,19.6H6.7v-1.4h6.6V19.6z',
                                    handleSize: '60%',
                                    handleStyle: {
                                        color: '#fff',
                                        shadowBlur: 1,
                                        shadowColor: 'rgba(0, 0, 0, 0.4)',
                                        shadowOffsetX: 1,
                                        shadowOffsetY: 1
                                    }
                                }],
                                tooltip: {
                              trigger: 'axis'
                          },
                          grid: {
                              left: '5%',
                              right: '1%',
                              bottom: '5%',
                              containLabel: true
                          },
                    //纵坐标使用科学计数法表示
                                yAxis:{
                                        type:Echart.yAxis.type,
                                        name:Echart.yAxis.name,
                                        nameGap:Echart.yAxis.nameGap,
                                        nameLocation:Echart.yAxis.nameLocation,
                                        axisLabel: {
                                        formatter: function (value) {
                                            var res = value.toString();
                                            var numN1 = 0;
                                            var numN2 = 1;
                                            var num1=0;
                                            var num2=0;
                                            var t1 = 1;
                                            for(var k=0;k<res.length;k++){
                                                if(res[k]==".")
                                                   t1 = 0;
                                                if(t1)
                                                   num1++;
                                                else
                                                   num2++;
                                            }

                                            if(Math.abs(value)<1 && res.length>4)
                                            {
                                                for(var i=2; i<res.length; i++){
                                                    if(res[i]=="0"){
                                                        numN2++;
                                                    }else if(res[i]==".")
                                                        continue;
                                                    else
                                                        break;
                                                }
                                                var v = parseFloat(value);
                                                v = v * Math.pow(10,numN2);
                                                return v.toString() + "e-" + numN2;
                                            }else if(num1>4)
                                            {
                                                if(res[0]=="-")
                                                    numN1 = num1 - 2;
                                                else
                                                    numN1 = num1 - 1;
                                                var v = parseFloat(value);
                                                v = v / Math.pow(10,numN1);
                                                if(num2 > 4)
                                                    v = v.toFixed(4);
                                                return v.toString() + "e" + numN1;
                                            }else
                                                return parseFloat(value);
                                        }
                                    }
                                },
                                xAxis:{
                                        type:Echart.xAxis.type,
                                        name:Echart.xAxis.name,
                                        nameGap:Echart.xAxis.nameGap,
                                        nameLocation:Echart.xAxis.nameLocation,
                                        data:Echart.xAxis.data,
                                        minInterval: 1,
                                        axisLabel: {
                                        formatter: function (value, index) {
                                            value = parseFloat(value);
                                            //保留小数位数
                                            return value.toFixed(4);
                                        } ,
                                    }
                                },
                //xAxis:  Echart.xAxis ,
                //yAxis: Echart.yAxis,
                series: Echart.series
            };