4基本绘图-2基本柱形图
using System.Windows.Forms;
using LiveCharts;
using LiveCharts.Wpf;
namespace Winforms.Cartesian.BasicBar
{
public partial class BasicColumnExample : Form
{
public BasicColumnExample()
{
InitializeComponent();
cartesianChart1.Series = new SeriesCollection
{
new ColumnSeries
{
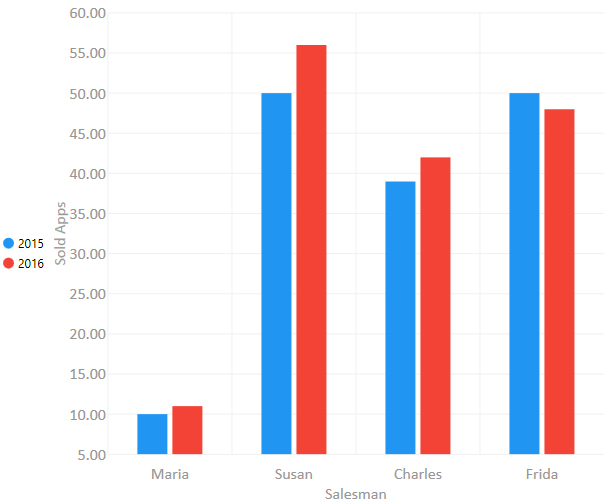
Title = "2015",
Values = new ChartValues<double> { 10, 50, 39, 50 }
}
};
//adding series will update and animate the chart automatically
cartesianChart1.Series.Add(new ColumnSeries
{
Title = "2016",
Values = new ChartValues<double> { 11, 56, 42 }
});
//also adding values updates and animates the chart automatically
cartesianChart1.Series[1].Values.Add(48d);
cartesianChart1.AxisX.Add(new Axis
{
Title = "Sales Man",
Labels = new[] {"Maria", "Susan", "Charles", "Frida"}
});
cartesianChart1.AxisY.Add(new Axis
{
Title = "Sold Apps",
LabelFormatter = value => value.ToString("N")
});
}
}
}