版权声明:本文为博主原创文章,未经博主允许不得转载。 https://blog.csdn.net/caomin1hao/article/details/82226051
matlab 图像中图像坐标系与plot、 imrotate坐标系的区别
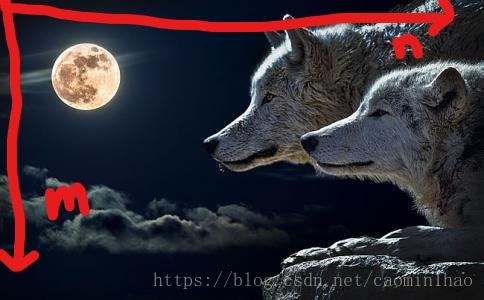
图像坐标系是以图像左上角为原点,访问图像像素点img(m,n),如下图所示:
plot的坐标系,以图像左上角为原点,在图像中划线时,plot(x,y),如下图所示:

图像旋转时,有时候需要求图像中两点间的斜率,求斜率坐标系依然以图像左上角为原点,如下图所示

示例程序如下所示:
clear all;clc;close all;
img = zeros(300,300);
img(150:156, 150:156) = 255;
img(30:36, 40:46) = 255;
figure,subplot(1,2,1),imshow(img);
hold on,
% 在30列画一条长度为150个像素的竖直线段
plot(30,1:150,'r');
% 连接两个白色区域中心坐标(43,33)、(153,153)
line([43,153],[33,153]);
hold off;
% 将两条直线旋转到垂直
% 即求图中蓝线的斜率
tan_=(-153-(-33))/(153-43)
sigma = atan(tan_);
img2 = imrotate(img,sigma*180/3.1415);
subplot(1,2,2),imshow(img2);