在Spring Cloud Netflix栈中,每个微服务都以HTTP接口的形式暴露自身服务,因此在调用远程服务时就必须使用到HTTP客户端。我们可以使用JDK原生的URLConnection、Apache的Http Client、Netty的异步HTTP Client,还有之前我们使用到Spring的RestTemplate,这些都可以实现远程调用。
1.什么是Turbine?
在之前我们了解到了hystrix提供了很多方式去监控服务健康状况,开始的话我们利用Hystrix DashBoard只能看到单个
服务的状况,但是我们经常接触到的是集群化的服务,这里就需要使用Turbine,可以将各断点聚合在仪表板上
2.Turbine基本使用
首先导入所需依赖
pom.xml
<dependency>
    <groupId>org.springframework.boot</groupId>
    <artifactId>spring-boot-starter-web</artifactId>
</dependency>
<dependency>
    <groupId>org.springframework.cloud</groupId>
    <artifactId>spring-cloud-starter-netflix-eureka-client</artifactId>
    <version>1.4.3.RELEASE</version>
</dependency>
<dependency>
    <groupId>org.springframework.boot</groupId>
    <artifactId>spring-boot-starter-actuator</artifactId>
</dependency>
<dependency>
    <groupId>org.springframework.cloud</groupId>
    <artifactId>spring-cloud-starter-netflix-hystrix</artifactId>
    <version>1.4.3.RELEASE</version>
</dependency>
<dependency>
    <groupId>org.springframework.cloud</groupId>
    <artifactId>spring-cloud-starter-netflix-turbine</artifactId>
    <version>1.4.3.RELEASE</version>
</dependency>
然后需要配置文件中配置用于查找的Eureka服务
application.yml
server:
  port: 10000
spring:
  application:
    name: consumer-order-hystrix-turbine
eureka:
  client:
    serviceUrl:
      defaultZone: http://user:user@localhost:8888/eureka
turbine:
  aggregator:
    clusterConfig: CONSUMER-ORDER-HYSTRIX # host:port/turbine.stream?cluster=<CLUSTERNAME> CLUSTERNAME即此处配置名称
  appConfig: consumer-order-hystrix
主程序上加上@EnableTurbine注解
HystrixTurbineApp.java
package com.ithzk.spring.cloud;

import org.springframework.boot.SpringApplication;
import org.springframework.boot.autoconfigure.SpringBootApplication;
import org.springframework.cloud.netflix.turbine.EnableTurbine;

/**
 * Hello world!
 *
 */
@SpringBootApplication
@EnableTurbine
public class HystrixTurbineApp
{
    public static void main( String[] args )
    {
        SpringApplication.run(HystrixTurbineApp.class);
    }
}
简单几步即可,这里我们需要启动他所监控的服务consumer-order-hystrix,也就是之前博客中的服务
这里也贴出来方便大家查看
pom.xml
 <!-- spring boot test -->
 <dependency>
     <groupId>org.springframework.boot</groupId>
     <artifactId>spring-boot-starter-test</artifactId>
     <scope>test</scope>
 </dependency>
 <dependency>
     <groupId>org.springframework.boot</groupId>
     <artifactId>spring-boot-starter-web</artifactId>
 </dependency>
 <!--eureka client -->
 <dependency>
     <groupId>org.springframework.cloud</groupId>
     <artifactId>spring-cloud-starter-netflix-eureka-client</artifactId>
     <version>1.4.3.RELEASE</version>
 </dependency>
 <dependency>
     <groupId>org.springframework.boot</groupId>
     <artifactId>spring-boot-starter-actuator</artifactId>
 </dependency>
 <dependency>
     <groupId>org.springframework.cloud</groupId>
     <artifactId>spring-cloud-starter-netflix-hystrix</artifactId>
     <version>1.4.3.RELEASE</version>
 </dependency>
application.yml
server:
  port: 8900
spring:
  application:
    name: consumer-order-hystrix
user:
  url: http://localhost:7900/user/
eureka:
  client:
    service-url:
      defaultZone:  http://user:user@localhost:8888/eureka/
OrderHystrixApp .java
package com.ithzk.spring.cloud;

import org.springframework.boot.SpringApplication;
import org.springframework.boot.autoconfigure.SpringBootApplication;
import org.springframework.cloud.client.circuitbreaker.EnableCircuitBreaker;
import org.springframework.cloud.netflix.eureka.EnableEurekaClient;
import org.springframework.context.annotation.Bean;
import org.springframework.web.client.RestTemplate;

/**
 * Hello world!
 *
 */
@SpringBootApplication
@EnableEurekaClient
@EnableCircuitBreaker//启用熔断
public class OrderHystrixApp {

    //相当于xml中的bean标签 用于调用当前方法获取到指定的对象
    @Bean
    public RestTemplate getRestTemplate(){
        return new RestTemplate();
    }

    public static void main( String[] args )
    {
        SpringApplication.run(OrderHystrixApp.class);
    }
}
OrderController .java
package com.ithzk.spring.cloud.controller;

import com.ithzk.spring.cloud.entity.User;
import com.netflix.appinfo.InstanceInfo;
import com.netflix.discovery.EurekaClient;
import com.netflix.hystrix.contrib.javanica.annotation.HystrixCommand;
import org.springframework.beans.factory.annotation.Autowired;
import org.springframework.beans.factory.annotation.Value;
import org.springframework.web.bind.annotation.GetMapping;
import org.springframework.web.bind.annotation.PathVariable;
import org.springframework.web.bind.annotation.RestController;
import org.springframework.web.client.RestTemplate;

/**
 * @author hzk
 * @date 2018/5/13
 */
@RestController
public class OrderController {

    //spring 提供用于访问rest接口的模板对象
    @Autowired
    private RestTemplate restTemplate;

    @Autowired
    private EurekaClient eurekaClient;

    @Value("${user.url}")
    private String url;

    @GetMapping("/order/{id}")
    @HystrixCommand(fallbackMethod = "defaultMethod")
    public User getOrder(@PathVariable Integer id){
        //访问提供者 获取数据 通过rest访问获取的json数据转换为的User对象
        //PROVIDER-USER 为eureka中提供者注册服务名称
        InstanceInfo instanceInfo = eurekaClient.getNextServerFromEureka("PROVIDER-USER", false);
        //获取接口项目地址
        String homePageUrl = instanceInfo.getHomePageUrl();

        User user = restTemplate.getForObject(homePageUrl + "/user/" +id, User.class);
        return user;
    }

    /**
     * 失败后执行的回调
     * @param id
     * @return
     */
    public User defaultMethod(Integer id){
        return new User(id+1000,"faild",88);
    }
}
启动Eureka Server,启动提供服务,消费服务以及Turbine应用
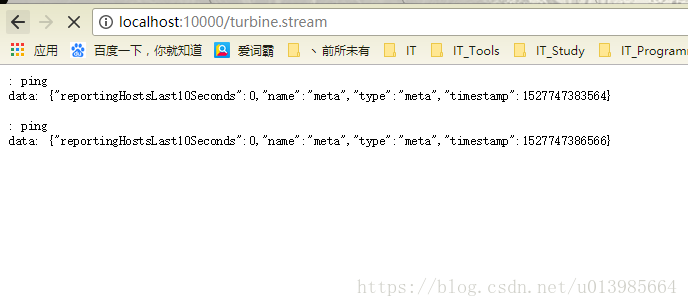
此时访问localhost:10000/turbine.stream?cluster=CONSUMER-ORDER-HYSTRIX
扫描二维码关注公众号,回复:
3569673 查看本文章

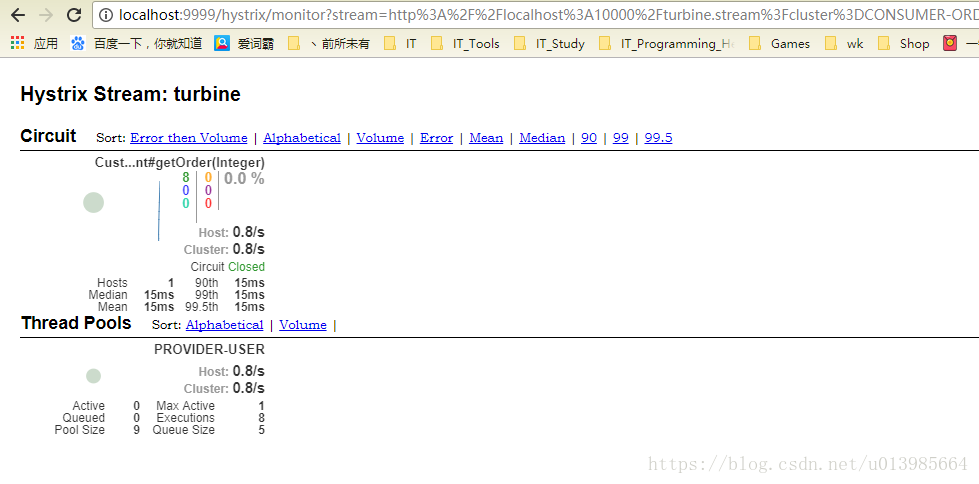
可以看到出现了和之前health类似的界面,实时监控者断路器状态
请求localhost:8900/order/xxx,再次观察页面
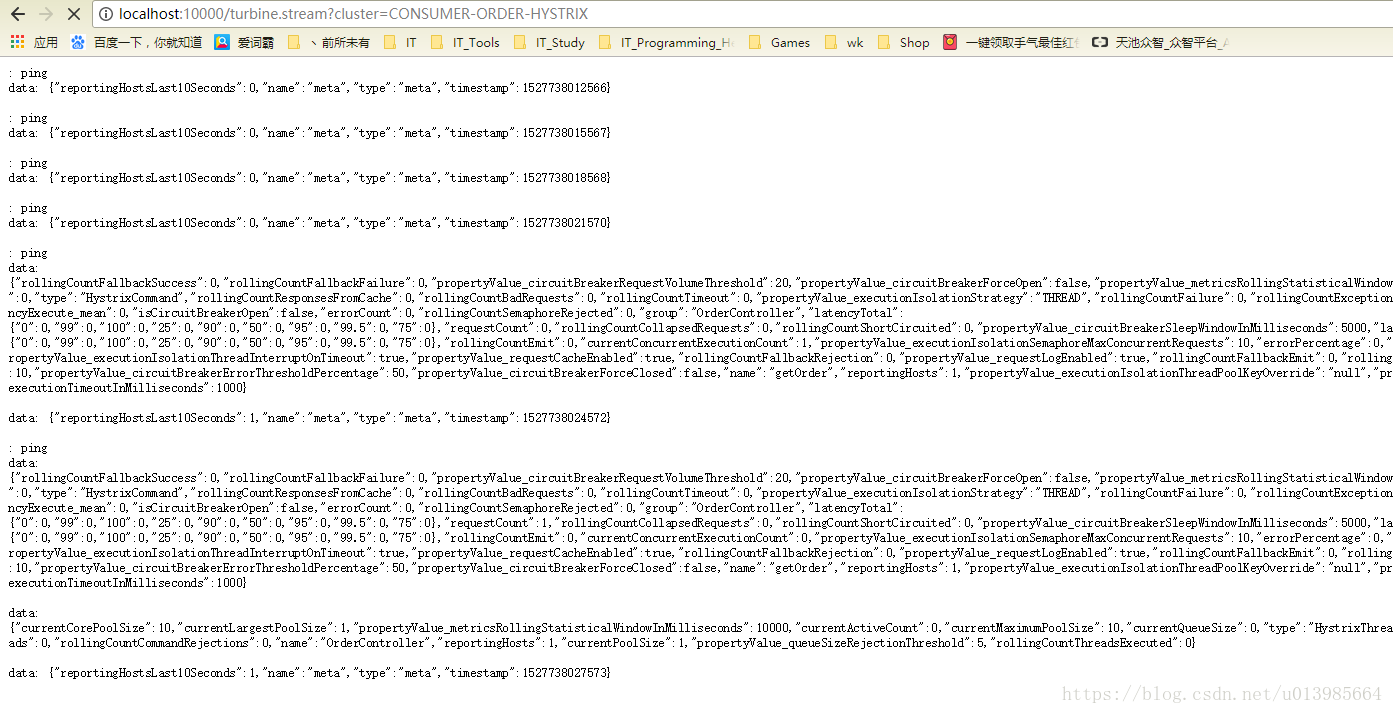
此时便出现了几乎和之前健康指标监控同样类型的监控数据
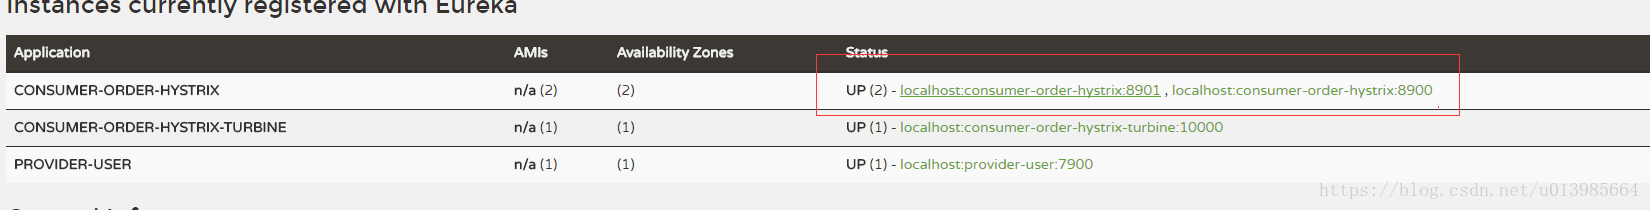
这里我们修改消费服务项目端口为8901,再次开启一个消费服务
这个时候可以看到Eureka server中会出现同一个应用名下挂有两台消费服务
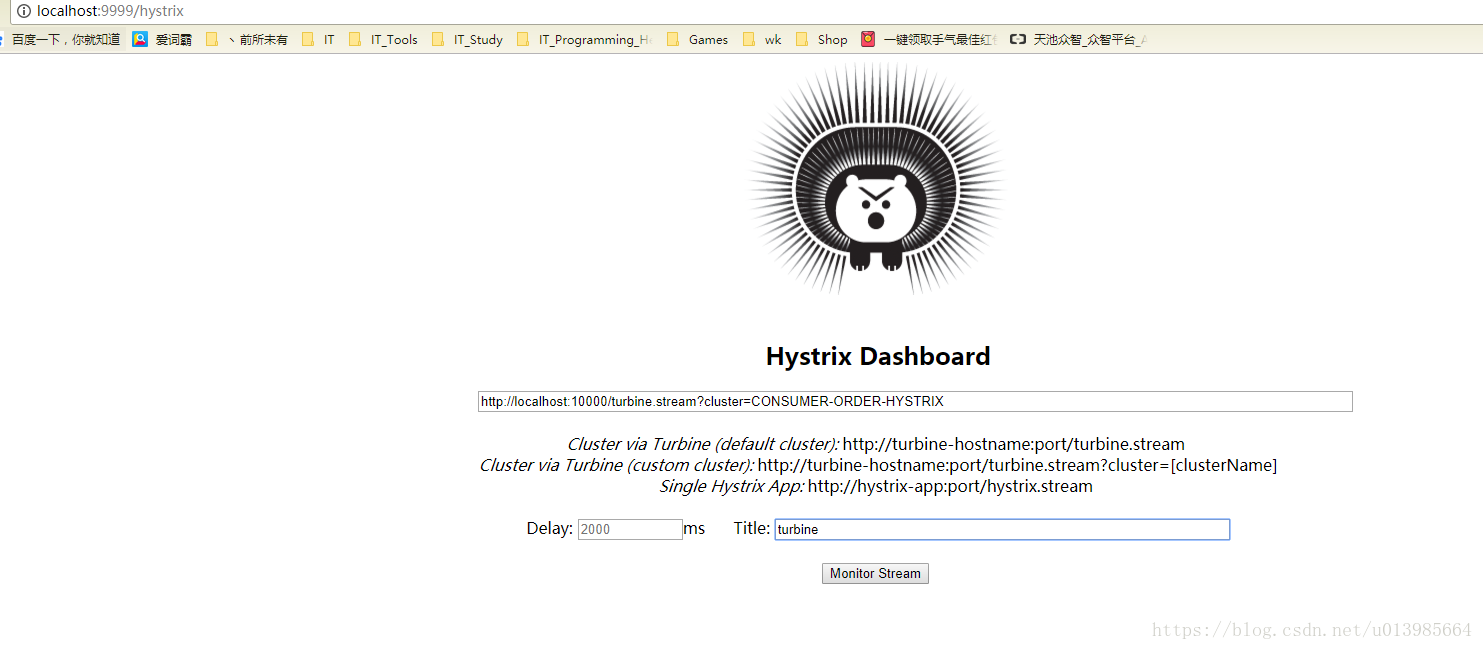
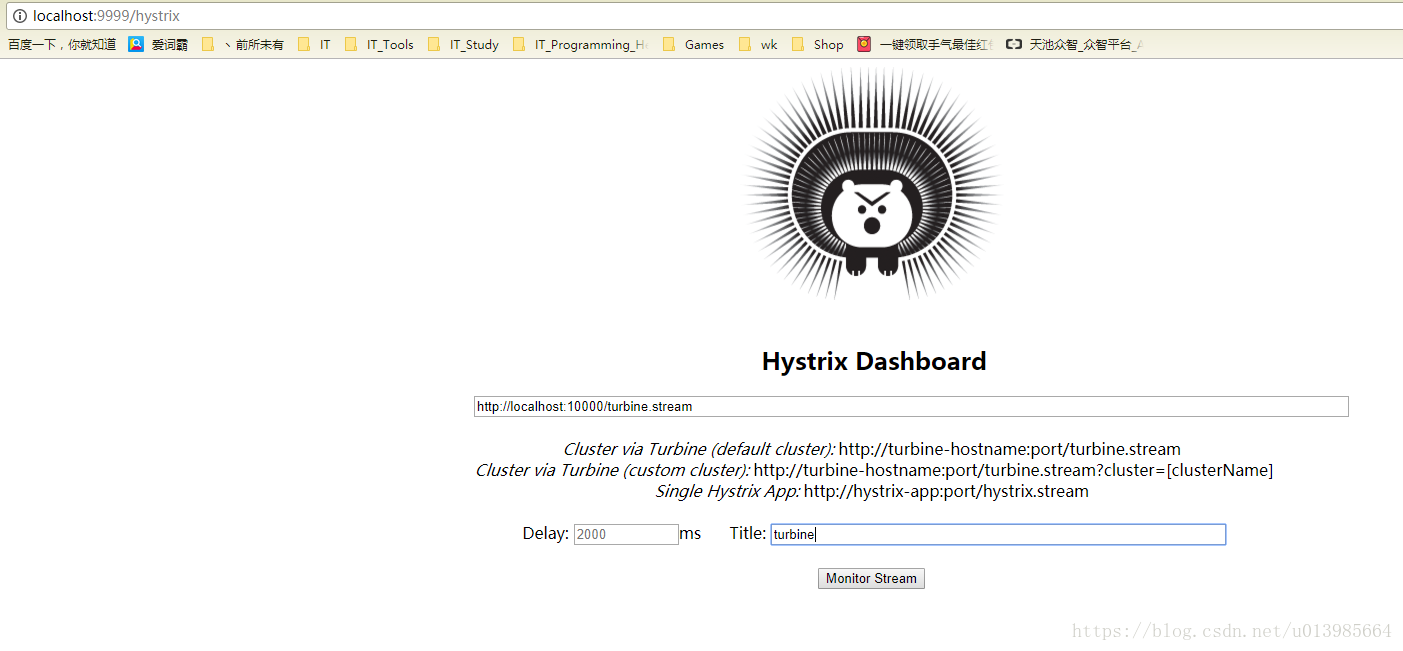
然后我们启动上篇博客中介绍的Dashboard仪表盘
将localhost:10000/turbine.stream?cluster=CONSUMER-ORDER-HYSTRIX配置进去
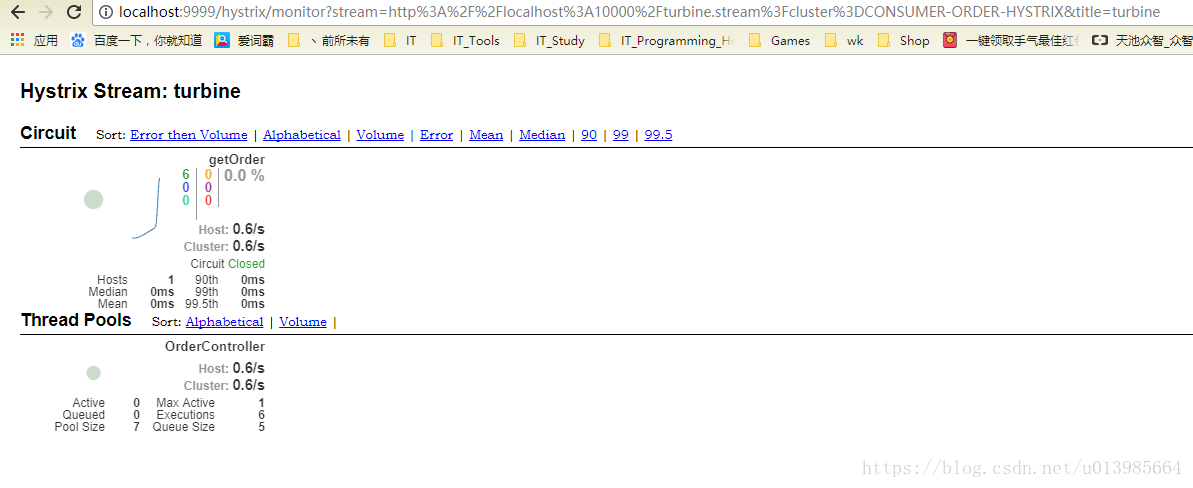
这个时候我们去访问localhost:8900/order/xx或是localhost:8901/order/xx
都可以发现dashboard中监控到了其断路器的状态
3.利用Turbine监控多个应用
上面我们利用Turbine实现了对同一应用的多台服务进行监控,这里如果我们需要同时监控多个应用需要怎么做呢
hystrix在设计turbine的时候也考虑到了这点,下面我们来了解一下

这里我们先启动Eureka server、提供服务、以及消费服务consumer-order-hystrix和consumer-order-feign-hystrix
这些我们在上面或者之前的博客中都有提到就不再贴出来了

然后我们的关键是来修改下上面所用到的turbine这个项目的配置文件
application.yml
server:
  port: 10000
spring:
  application:
    name: consumer-order-hystrix-turbine
eureka:
  client:
    serviceUrl:
      defaultZone: http://user:user@localhost:8888/eureka
turbine:
  aggregator:
    clusterConfig: default
  appConfig: consumer-order-hystrix,consumer-order-feign-hystrix
  cluster-name-expression: "'default'"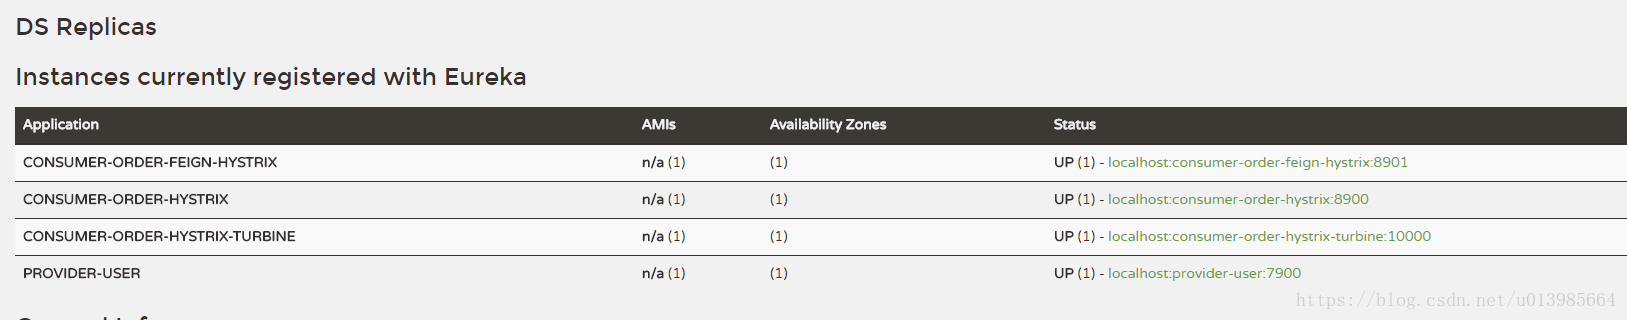
这里可以看到我们注册了consumer-order-hystrix和consumer-order-feign-hystrix两个消费服务
在监控多个应用的情况下,只需要访问localhost:10000/turbine.stream即可看到断路器状态
然后启动dashboard仪表板应用,将监控地址填入
这个时候我们分别去请求localhost:8900/order/xx和localhost:8901/order/xx
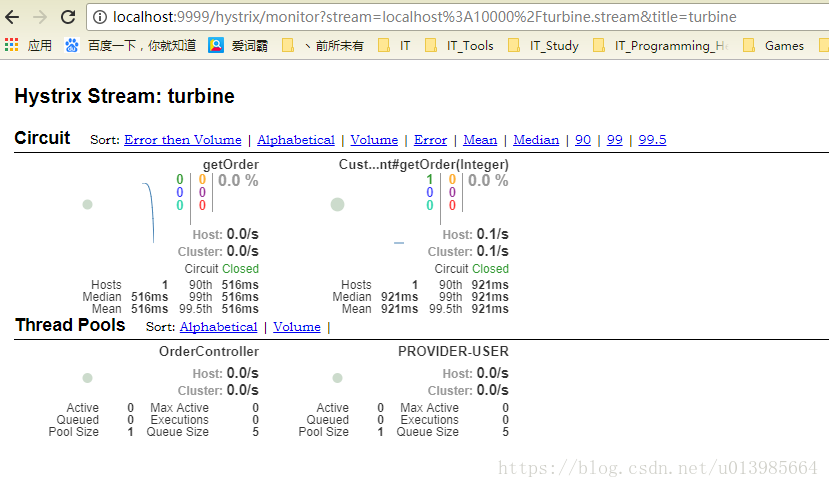
可以看到同时可以实现监控两个应用断路器的状态情况,这里由于请求的接口都为getOrder
所以可能会造成一点混淆,实质上之前是讲一个应用部署多台服务同时提供,但这里是多个应用分开监控
其实整体实现还是很方便的,如果不是特别需要解析深层,利用简单的配置就能实现
4.Turbine监测配置Context-path服务
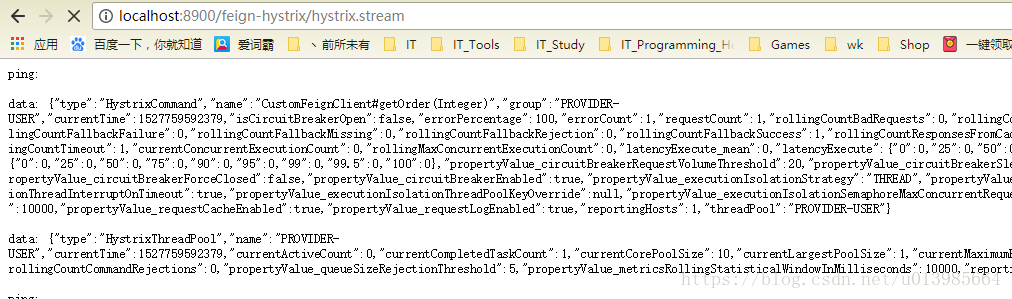
在之前我们可以发现健康监测默认路径是host:port/hystrix.stream
并且我们使用turbine的时候他也是默认去检测host:port/hystrix.stream这个路径下的数据状况
如果我们项目配置了context-path,导致项目请求都需要加上配置的名称,即host:port/context-path/
此时turbine则依然会去检测没有context-path的路径,所以会导致检测不到断路器状态

在Spring-cloud官方文档里面提到了如何去解决这种情况
首先我们将之前的consumer-order-feign-hystrix服务设置context-path
application.yml
server:
  port: 8900
  context-path: /feign-hystrix
spring:
  application:
    name: consumer-order-feign-hystrix
user:
  url: http://localhost:7900/user/
eureka:
  client:
    service-url:
      defaultZone:  http://user:user@localhost:8888/eureka/
feign:
  hystrix:
    enabled: true # feign启用fallback机制
此时启动会发现所有请求都需要加上配置的context-path才可以成功,包括hystrix.stream健康指标
我们直接启动上面turbine应用,此时配置文件如下:
application.yml
server:
port: 10000
spring:
application:
name: consumer-order-hystrix-turbine
eureka:
client:
serviceUrl:
defaultZone: http://user:user@localhost:8888/eureka
turbine:
aggregator:
clusterConfig: CONSUMER-ORDER-FEIGN-HYSTRIX # host:port/turbine.stream?cluster=<CLUSTERNAME> CLUSTERNAME即此处配置名称
appConfig: consumer-order-feign-hystrix
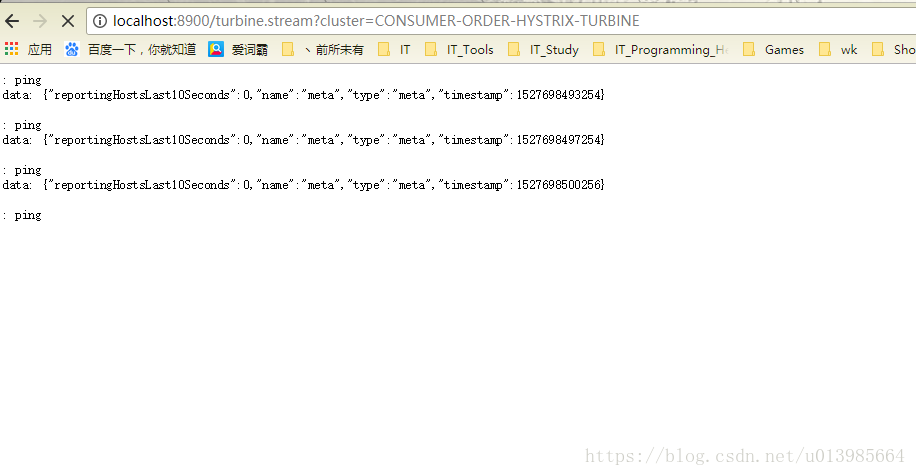
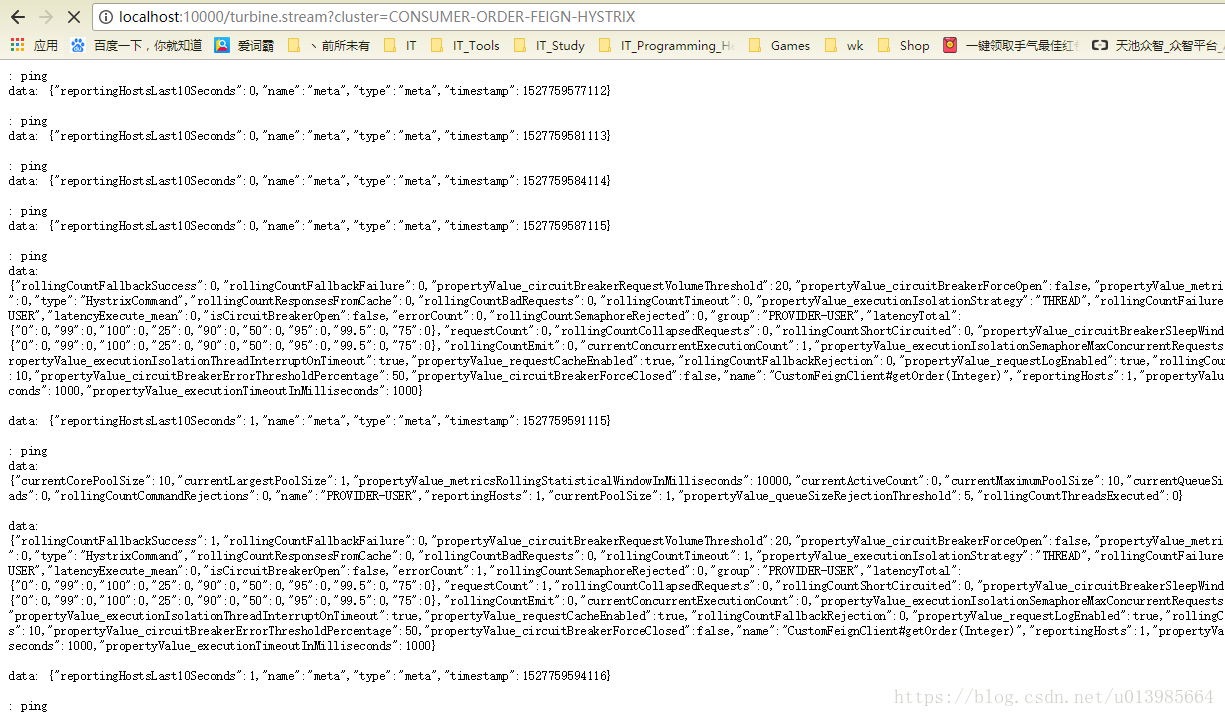
cluster-name-expression: "'default'"此时去查看localhost:10000/turbine.stream?cluster=CONSUMER-ORDER-FEIGN-HYSTRIX
然后可以发现无论怎么消费,都不会检测到断路器状态,这就是因为他默认是不会去加上context-path
所以后台也会报出无法请求到的异常
官网提出了解决方案,只需简单修改配置文件也可以很容易实现
application.yml
server:
  port: 10000
spring:
  application:
    name: consumer-order-hystrix-turbine
eureka:
  client:
    serviceUrl:
      defaultZone: http://user:user@localhost:8888/eureka
turbine:
  aggregator:
    clusterConfig: CONSUMER-ORDER-FEIGN-HYSTRIX # host:port/turbine.stream?cluster=<CLUSTERNAME> CLUSTERNAME即此处配置名称
    # clusterConfig: default
  appConfig: consumer-order-feign-hystrix
  # cluster-name-expression: "'default'"
turbine.instanceUrlSuffix.CONSUMER-ORDER-FEIGN-HYSTRIX: /feign-hystrix/hystrix.stream # 配置hystrix.stream的访问地址
可以看出主要不同的在于turbine.instanceUrlSuffix.CONSUMER-ORDER-FEIGN-HYSTRIX: /feign-hystrix/hystrix.stream
这个配置,turbine.instanceUrlSuffix.ApplicationName(Eureka Server上应用名称): /contenxt-path/hystrix.stream
只需要配置这一项,turbine.stream就会修改检测的地址
启动dashboard也可以正常访问仪表板