说明:本文仅作为本人学习<<深入理解Spring Cloud与微服务构建>>一书的学习笔记,所有代码案例及文字描述均参考该书,不足之处,请留言指正,不胜感激.
一.Turbine能解决什么问题
在使用Hystrix Dashboard组件监控服务的熔断情况时,每个服务都有一个Hystrix Dashboard主页,当服务数量很多时,监控非常不方便.为了同时监控多个服务的熔断器的状况,Netflix开源了Hystrix的另一个组件Turbine.Turbine用于聚合多个Hystrix Dashboard,将多个Hystrix Dashboard组件的数据放在一个页面上展示,进行集中监控.
二.单独搭建一个Turbine服务.
1.新建一个module工程,取名turbine-server.
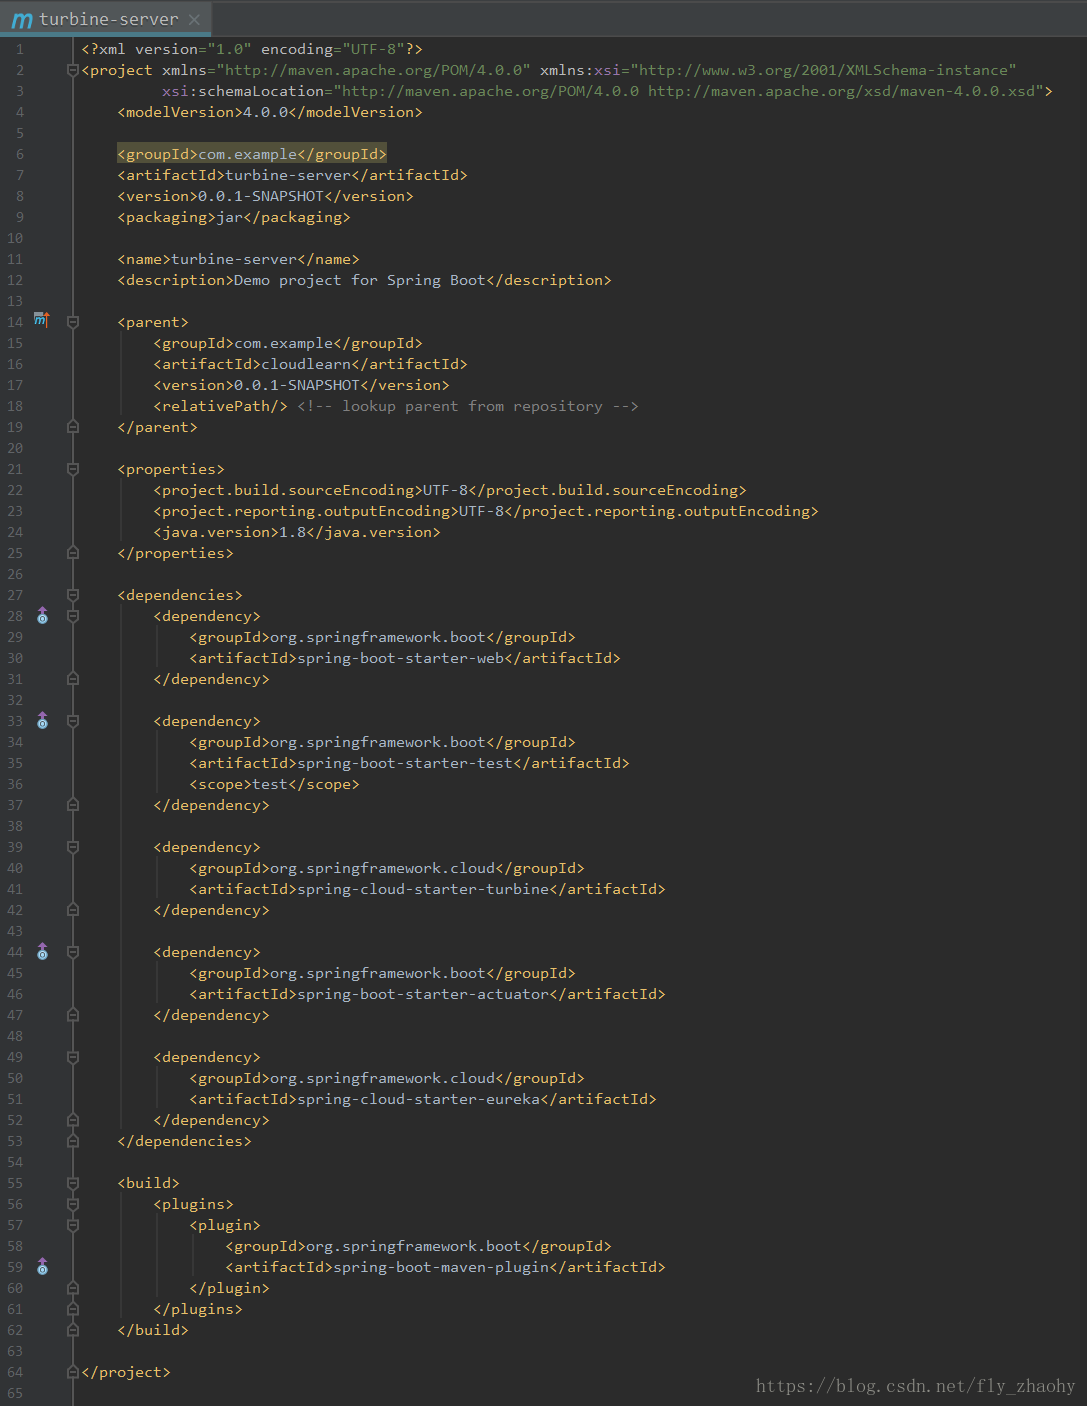
2.pom文件引入相关依赖,包括eureka,turbine,acturtor的起步依赖,如下:
3.然后在配置文件application.yml加上相关配置,具体配置代码如下:
spring:
  application:
    name: turbine-server
server:
  port: 8769
turbine:
  appConfig: producer-server,customer-server  #配置需要监控的服务名
  clusterNameExpression: new String("default") #默认为服务名的集群,此时用默认即可
eureka:
  client:
    service-url:
      defaultZone: http://localhost:8761/eureka/
4.在启动类上加上@EnableTurbine,开启Turbine功能.
/**
* Turbine服务
*
* @author zhyu
* @version v1.0
* @date 2018年06月28日 19:09:03
*/
@SpringBootApplication
@EnableEurekaClient
@EnableTurbine
public class TurbineServerApplication {
public static void main(String[] args) {
SpringApplication.run(TurbineServerApplication.class, args);
}
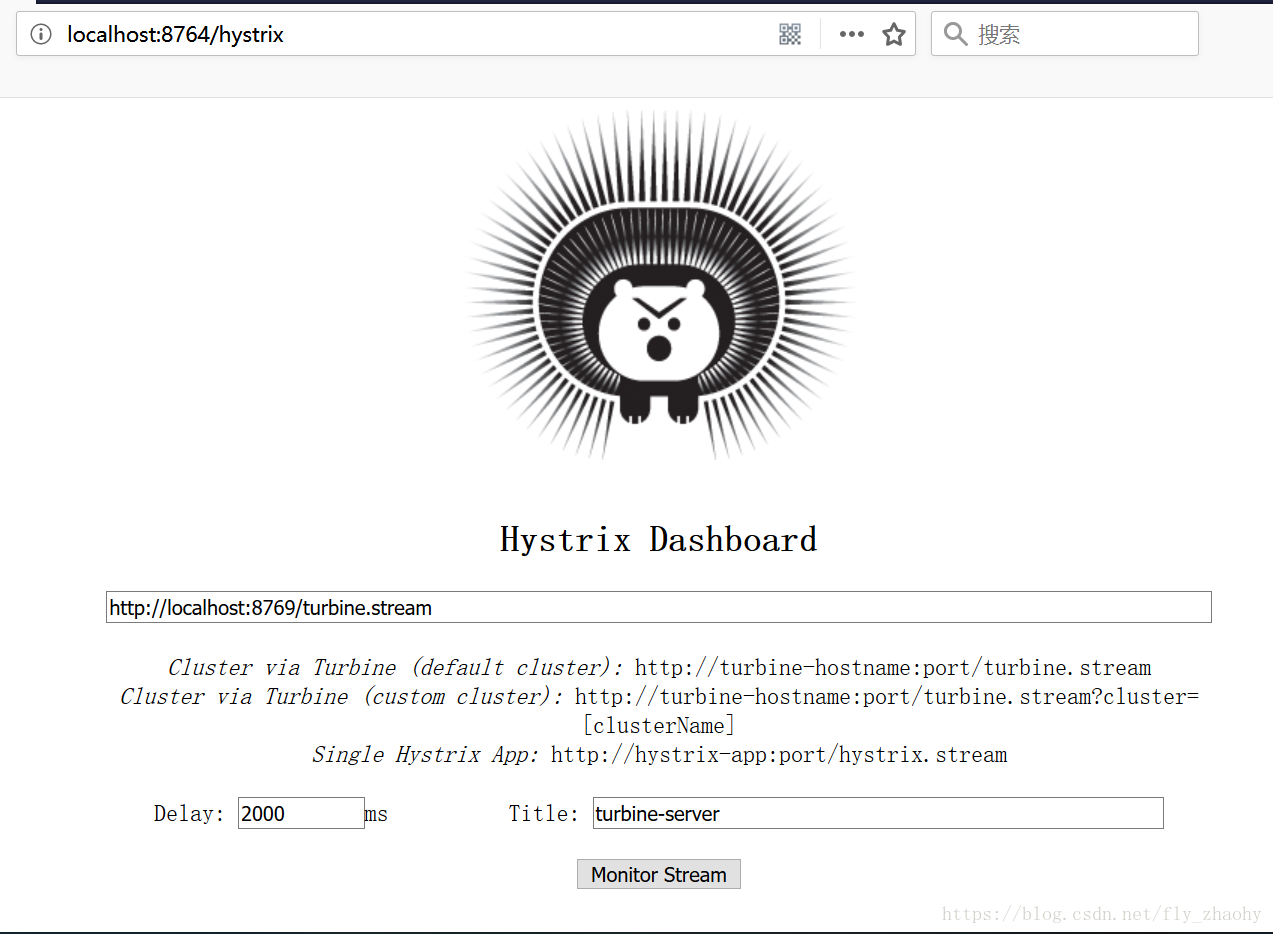
}这里我在生产者服务中也启用了Feign和Hystrix,让生产者服务和消费者服务互相调用,并对Feign做了熔断,并且这两个服务都开启了Hystrix Dashboard监控.接着,我们依次启动eureka-server,producer-server,customer-server,turbine-server,并访问生产者和消费者服务相互调用的接口,然后在浏览器打开消费者服务的Hystrix Dashboard页面:http://localhost:8764/hystrix ,输入以下信息:
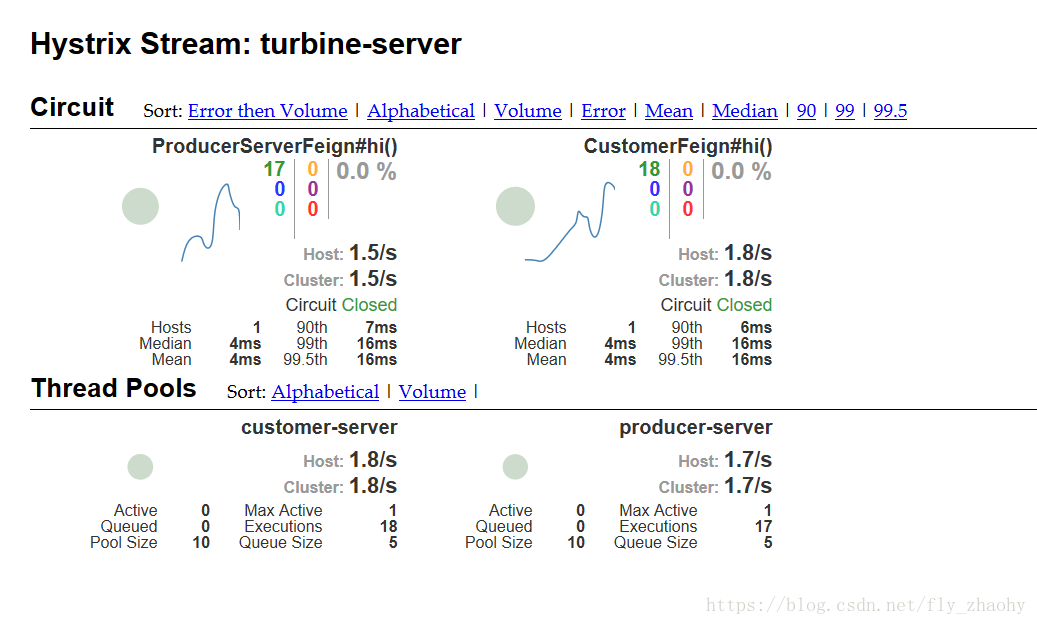
可见,生产者和消费者服务的熔断器状态都显示到了一个页面上,最基本的Turbine服务配置成功.