import requests
import pygal
from pygal.style import LightColorizedStyle as LCS,LightenStyle as LS
#执行API调用并存储响应
url='https://api.github.com/search/repositories?q=language:python&sort=stars'
r=requests.get(url)
print('status code: ',r.status_code)
#将API响应存储在一个变量中
response_dict=r.json()
#指出GitHub包含多少python仓库
print("Total repositories: ",response_dict['total_count'])
#探索有关仓库的信息
repo_dicts=response_dict['items']
print("number of items: ",len(repo_dicts))
names,plot_dicts=[],[]
for repo_dict in repo_dicts:
names.append(repo_dict['name']) #为生成x轴的标签
plot_dict={'value':repo_dict["stargazers_count"],
'label':str(repo_dict["description"]),
'xlink':repo_dict['html_url'],
} #value为值,label为描述,xlink为添加的链接
plot_dicts.append(plot_dict) #为生成存储的值和项目描述(点击条形图,出现描述)
#可视化
my_style=LS('#333366',base_style=LCS)
#配置图表格式
my_config=pygal.Config()
my_config.x_label_rotation=45 #x轴标签旋转45度
my_config.show_legend=False #隐藏图例
my_config.title_font_size=24 #设置标题字体
my_config.label_font_size=14 #设置副标签字体
my_config.major_label_font_size=18 #设置主标签字体
my_config.truncate_label=15 #将较长的项目名缩短为15个字符
my_config.show_y_guides=False #隐藏图标的水平线
my_config.width=1000 #自定义图标宽度
#bar创建条形图
chart=pygal.Bar(my_config,style=my_style)
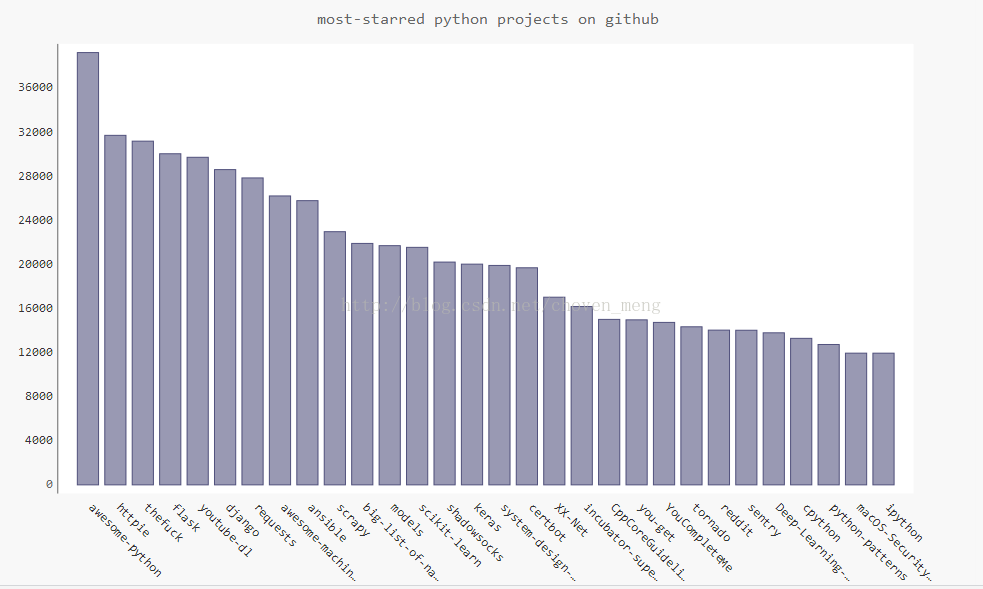
chart.title='most-starred python projects on github'
chart.x_labels=names
chart.add('',plot_dicts) #空字符串不需给数据添加标签
import pygal
from pygal.style import LightColorizedStyle as LCS,LightenStyle as LS
#执行API调用并存储响应
url='https://api.github.com/search/repositories?q=language:python&sort=stars'
r=requests.get(url)
print('status code: ',r.status_code)
#将API响应存储在一个变量中
response_dict=r.json()
#指出GitHub包含多少python仓库
print("Total repositories: ",response_dict['total_count'])
#探索有关仓库的信息
repo_dicts=response_dict['items']
print("number of items: ",len(repo_dicts))
names,plot_dicts=[],[]
for repo_dict in repo_dicts:
names.append(repo_dict['name']) #为生成x轴的标签
plot_dict={'value':repo_dict["stargazers_count"],
'label':str(repo_dict["description"]),
'xlink':repo_dict['html_url'],
} #value为值,label为描述,xlink为添加的链接
plot_dicts.append(plot_dict) #为生成存储的值和项目描述(点击条形图,出现描述)
#可视化
my_style=LS('#333366',base_style=LCS)
#配置图表格式
my_config=pygal.Config()
my_config.x_label_rotation=45 #x轴标签旋转45度
my_config.show_legend=False #隐藏图例
my_config.title_font_size=24 #设置标题字体
my_config.label_font_size=14 #设置副标签字体
my_config.major_label_font_size=18 #设置主标签字体
my_config.truncate_label=15 #将较长的项目名缩短为15个字符
my_config.show_y_guides=False #隐藏图标的水平线
my_config.width=1000 #自定义图标宽度
#bar创建条形图
chart=pygal.Bar(my_config,style=my_style)
chart.title='most-starred python projects on github'
chart.x_labels=names
chart.add('',plot_dicts) #空字符串不需给数据添加标签
chart.render_to_file('python_repo.svg')