代码部分参考了大神的 https://blog.csdn.net/yc_1993/article/details/54933751
再加上了滚动条与暂停功能。代码中还包含了一些小的功能,例如可以对每个数值进行设置y-value。但是我综合考虑了最终的效果,最后都注释掉了,如果有需要的话,可以取消注释来使用。
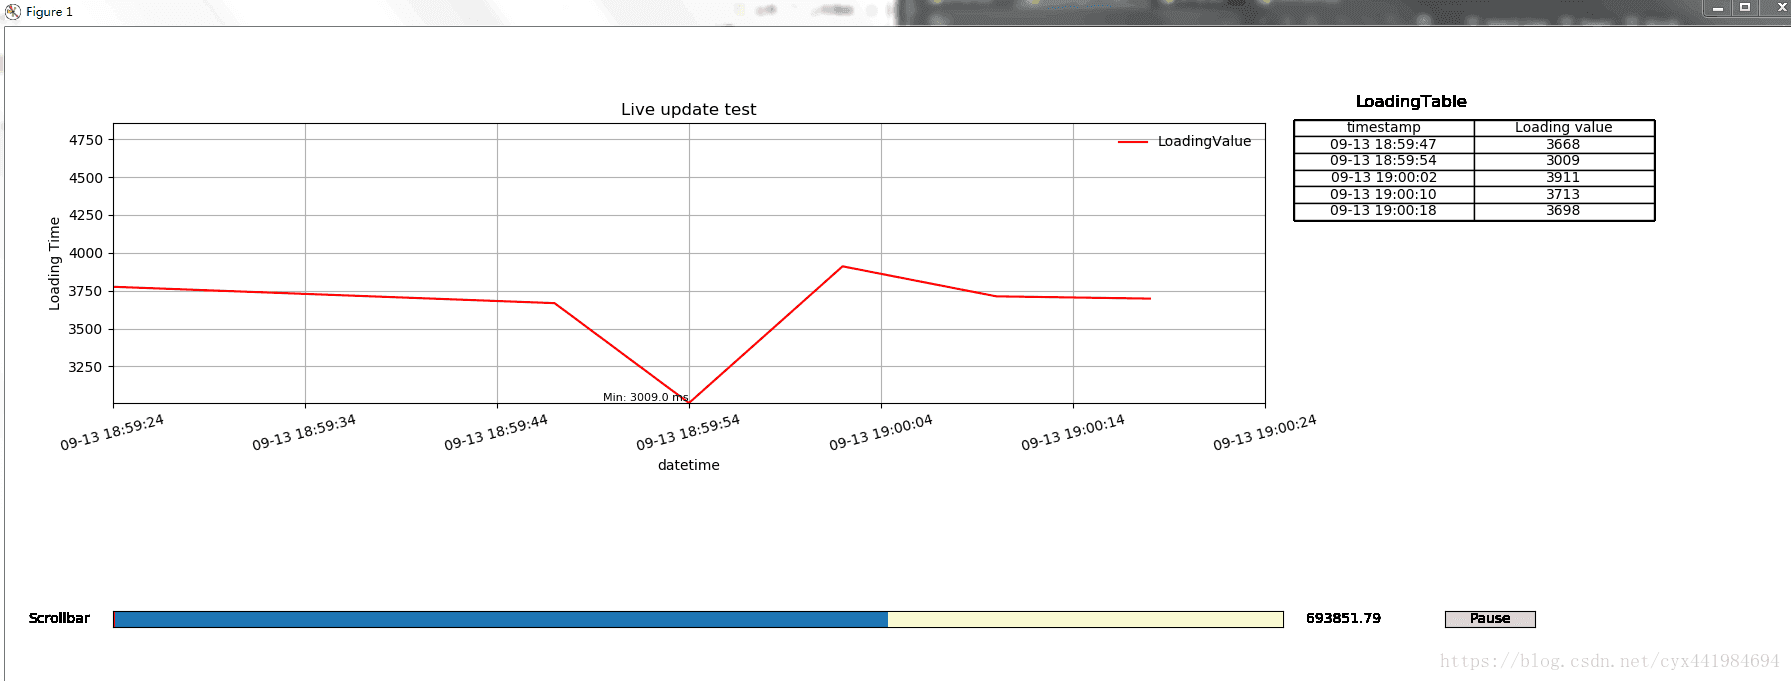
最终效果如下:
图像会根据数据实时进行更新,也就是数据跟图像都是实时刷新的。表格会显示最近的五个数值。如果直接拉动滚动条的话,可能反应会有点慢。可以先按下 “Pause” 按钮,暂停绘图,然后拉动下方的滚动条来回顾过去的数据。
代码分为两个部分,一部分是数据如何产生,第二部分为图表绘制。
1. 数据产生
数据是实时产生的(初始是没有的,需要成功登录网页后获取到相关数据后才有),利用Selenium,每5秒刷新一某网页,并调用JS "Windonw.performance.timing“ 来计算完全加载所需时间,并得到当前时间。有关Selenium的使用,可以谷歌相关的用法。可能有空的时候我也写个小教程,当初踩了不少坑.....
2. 图表绘制
利用ion来绘制动态图。那么分为三大部分
- 1) 初始值的设定
- 2)框架的定义
- 3)数据传入并绘制
- 4 ) 关闭ion并显示图像
重点讲解下一下几点
- 数据如何传入
简单来说就是要让数据的两个因素, dtime还有onloadingtime能够传入,需要结合下面的调用环节来理解。这里就是简单地在函数DetectionPlot那里传入参数,并把新得到的参数,附加成为列表类型。
- 横纵坐标的设定
self.loadingGraph.xaxis.set_ticks(self.timestamp1)
self.loadingGraph.yaxis.set_ticks(self.loadingValue1)
如果直接设置了set_ticks的话,那么以下这几行代码将不会生效,那么图标的横纵坐标就会不断地压缩。
self.loadingGraph.set_ylim(
                min(self.loadingValueRange), max(self.loadingValueRange))
self.loadingGraph.set_xlim(
                self.timestampRange[1] - dt.timedelta(minutes=1), self.timestampRange[1])
另外注意一点就是,如果你想横坐标是时间,你需要首先将时间从string类型转换为datetime类型,这样才能够与datetime.timedelta进行相加减。然后利用下面的两行代码,将横坐标的格式定义为datetime类型,那么Matplotlib就能帮你处理。纵坐标也是相同的道理。
self.dateFormat = DateFormatter("%m-%d %H:%M:%S")
self.loadingGraph.xaxis.set_major_formatter(ticker.FuncFormatter(self.dateFormat))- 滚动条与暂停功能
这两个部分,就是首先定义相关的位置,然后与功能函数挂钩。Matplotlib的API上有相关的简介。
这里具体说一下,由于横坐标是时间类型,那么怎么设置滚动条。
首先Slider定义上包含了一个最小值,跟最大值。这里要对datetime类型进行转换。
功能定义函数上,就要转换为datetime类型,要不然matplotlib识别不了。然后就是利用拉动的变量来定义横坐标。
# Add a scroll bar
        self.axcolor = 'lightgoldenrodyellow'
        self.axsb = fig.add_axes([0.06, 0.25, 0.65, 0.02], facecolor=self.axcolor)

#Slider setting
        self.ssb = Slider(self.axsb, 'Scrollbar',
                              dates.date2num(self.timestampRange[0]),
                              dates.date2num(self.timestampRange[1]))
        self.ssb.on_changed(self.update)

#Define the slider update function
    def update(self,val):
        self.sb=self.ssb.val
        self.xmin_time=dates.num2date(self.sb)-dt.timedelta(minutes=1)
        self.xmax_time=dates.num2date(self.sb)
        self.loadingGraph.axis([self.xmin_time,self.xmax_time,min(self.loadingValueRange), max(self.loadingValueRange)])
        fig.canvas.draw_idle()
3. 调用
数据部分由于需要实时返回,因此我使用了yield这个generator。注意不要用return,return只能返回一次值就会停止了。
当需要使用yield回来的两个值时候:
    for times,values in Getdata():
        graph.DetectionPlot(times,values)
你也可以使用静态形式来查看图表的情况,取消注释 以下两段。
timelist = ['08-31 11:17:27', '08-31 11:17:34', '08-31 11:17:41', '08-31 11:18:27',
             '08-31 11:18:47', '08-31 11:19:47','08-31 11:19:49']
onloadlist = ['25032', '6558', '383', '3383', '1111', '2345','5000']
#If timelist and onloadlist is not "#", you can use the following to do the static test.
for i in range(len(timelist)):
graph.DetectionPlot(timelist[i], onloadlist[i])然后注释掉上面的Getdata()部分。
完整代码如下:
from matplotlib.widgets import Button, Slider
import datetime as dt
import matplotlib.pyplot as plt
from matplotlib.dates import DateFormatter, DayLocator
import matplotlib.ticker as ticker
from datetime import datetime
import matplotlib.transforms as transforms
from matplotlib import dates
import getpass
import time
import sys
from selenium.webdriver.common.by import By
from selenium.webdriver.support.ui import WebDriverWait
from selenium.webdriver.support import expected_conditions as EC
from selenium.common.exceptions import TimeoutException
from selenium.webdriver.chrome.options import Options
from datetime import datetime
from selenium.common.exceptions import NoSuchElementException
from selenium import webdriver
import matplotlib
matplotlib.use('TkAgg')

class streamDetectionPlot(object):
    # Initial the figure parameters
    def __init__(self):
        # Turn the interactive mode on
        plt.ion()
        # initial the plot variable
        self.timestamp = []
        self.loadingValue = []
        self.highlightList = []
        self.highlightListTurnOn = True
        self.loadingValueRange = [0, 1]
        self.timestampRange = [0, 1]
        self.tableValue = [[0, 0]]
        self.timestamp1 = []
        self.loadingValue1 = []

        # initial the figure
        global fig
        fig = plt.figure(figsize=(18, 8), facecolor="white")
        fig.subplots_adjust(left=0.06, right=0.70)
        self.loadingGraph = fig.add_subplot(2, 1, 1)
        ##add_axes(rect,**kwargs) Meaning:##rect: left,bottom,width,height
        self.loadingTable = fig.add_axes([0.72, 0.1, 0.2, 0.8], frameon=False)

        # Add a scroll bar
        self.axcolor = 'lightgoldenrodyellow'
        self.axsb = fig.add_axes([0.06, 0.25, 0.65, 0.02], facecolor=self.axcolor)

        # Add the pause button
        self.pauseax = fig.add_axes([0.8, 0.25, 0.05, 0.02], facecolor=self.axcolor)

    # define the initial plot method
    def initPlot(self):
        # initial two lines
        self.line, = self.loadingGraph.plot_date(self.timestamp, self.loadingValue, fmt="-", color="red",
                                                 label="LoadingValue")
        self.loadingGraph.legend(loc="upper right", frameon=False)
        self.loadingGraph.grid(True)

        # Set the baseline of 5000, horizen use "axhline" while vertical uses "axvline"
        self.baseline = self.loadingGraph.axhline(5000, color='black', lw=1)

        # Add the "5000" to the y-axis label next to the line
        # trans = transforms.blended_transform_factory(
        #     self.loadingGraph.get_yticklabels()[0].get_transform(), self.loadingGraph.transData)
        # self.loadingGraph.text(0, 5000, "{:.0f}".format(5000), color="black", transform=trans, ha="right", va="center")

        # Set the title
        self.loadingGraph.set_title("Live update test")

        # set the x/y label of the first graph
        self.loadingGraph.set_xlabel("datetime")
        self.loadingGraph.set_ylabel("Loading Time")

        # axis format
        self.dateFormat = DateFormatter("%m-%d %H:%M:%S")
        self.loadingGraph.xaxis.set_major_formatter(ticker.FuncFormatter(self.dateFormat))

        ##Configure the table
        self.loadingTableColumnName = ["timestamp", "Loading value"]
        self.loadingTable.set_xticks([])
        self.loadingTable.set_yticks([])

    # define the output method
    def DetectionPlot(self, timestamp, loadingValue):
        if not pause:
            # update the plot value of the graph
            self.timestamp.append(timestamp)
            self.loadingValue.append(loadingValue)

            # From string to datetime
            self.timestamp1 = [datetime.strptime(d, "%m-%d %H:%M:%S") for d in self.timestamp]
            self.loadingValue = [float(i) for i in self.loadingValue]

            # pretty date names
            plt.gcf().autofmt_xdate()

            # update the x/y range
            self.timestampRange = [min(self.timestamp1), max(self.timestamp1) + dt.timedelta(minutes=0.1)]  # datetime style
            self.loadingValueRange = [min(self.loadingValue), max(self.loadingValue) + 1]

            # update the x/y axis limits
            self.loadingGraph.set_ylim(
                min(self.loadingValueRange), max(self.loadingValueRange))
            self.loadingGraph.set_xlim(
                self.timestampRange[1] - dt.timedelta(minutes=1), self.timestampRange[1])

            # Set the y-ticks if the variation is above 1000
            # https://stackoverflow.com/questions/39969217/ytick-overlapping-in-matplotlib
            # self.loadingValue1 = [min(self.loadingValue)]
            # for i in sorted(self.loadingValue[0:]):
            #     if i - self.loadingValue1[-1] > 1000:
            #         self.loadingValue1.append(i)

            # Set the ticks
            # self.loadingGraph.xaxis.set_ticks(self.timestamp1)
            # self.loadingGraph.yaxis.set_ticks(self.loadingValue1)

            # update the two lines
            self.line.set_xdata(self.timestamp1)
            self.line.set_ydata(self.loadingValue)

            # The x-data is being updated, but the plot ranges are not. When I put new data on the plot, it was all out of range. The solution was to add:
            self.loadingGraph.relim()
            self.loadingGraph.autoscale_view()

            # Rotate the x-array
            for tick in self.loadingGraph.get_xticklabels():
                tick.set_rotation(15)

            # Plot the value of y on the plot.
            # for xp, yp in zip(self.timestamp1[1:-1], self.loadingValue[1:-1]):
            #     label = "%s" % yp
            #     self.loadingGraph.text(xp, yp, label, fontsize=8, horizontalalignment='right', verticalalignment='bottom')

            #Clear the text first
            for txt in self.loadingGraph.texts:
                txt.set_visible(False)
            #Set the maximum and minimum value of y on the plot.
            self.max_y, self.min_y = max(self.loadingValue), min(self.loadingValue)
            self.max_x, self.min_x = self.timestamp1[self.loadingValue.index(self.max_y)], self.timestamp1[
                self.loadingValue.index(self.min_y)]
            self.maxlabel, self.minlabel = "Max: %s ms" % self.max_y, "Min: %s ms" % self.min_y
            self.loadingGraph.text(self.max_x, self.max_y, self.maxlabel, fontsize=8, horizontalalignment='right',
                                   verticalalignment='bottom')
            self.loadingGraph.text(self.min_x, self.min_y, self.minlabel, fontsize=8, horizontalalignment='right',
                                   verticalalignment='bottom')


            # update the highlight of the graph. The x will be 1 second varitation
            if int(loadingValue) >= 5000:
                self.highlightList = self.timestamp1
                self.highlightListTurnOn = True
            else:
                self.highlightListTurnOn = False
            if len(self.highlightList) != 0 and self.highlightListTurnOn is False:
                self.loadingGraph.axvspan(
                    self.highlightList[0] - dt.timedelta(seconds=1),
                    self.highlightList[-1] + dt.timedelta(seconds=1),
                    color='r',
                    edgecolor=None,
                    alpha=0.2
                )
                self.highlightList = []
                self.highlightListTurnOn = True

            # Update the table with the latest 5 entries
            self.loadingTableColumnName = ["timestamp", "Loading value"]
            self.loadingTable.text(0.15, 1, "LoadingTable", size=12)
            self.loadingTable = fig.add_axes([0.72, 0.1, 0.2, 0.8], frameon=False)
            self.loadingTable.set_xticks([])
            self.loadingTable.set_yticks([])
            self.tableValue.append([timestamp, loadingValue])

            if len(self.tableValue) >= 6: self.tableValue.pop(0)
            self.loadingTable.table(cellText=self.tableValue,
                                    colWidths=[0.5] * 2,
                                    colLabels=self.loadingTableColumnName,
                                    loc=1,
                                    cellLoc='center'
                                    )

            #Slider setting
            self.ssb = Slider(self.axsb, 'Scrollbar',
                              dates.date2num(self.timestampRange[0]),
                              dates.date2num(self.timestampRange[1]))
            self.ssb.on_changed(self.update)

        #Pause Button setting
        self.button=Button(self.pauseax,'Pause',color='0.85',hovercolor='0.975')
        self.button.on_clicked(self.setpause)


        # plot pause 0.0001 second and then plot the next one.
        plt.pause(1)
        plt.draw()

    #Define the slider update function
    def update(self,val):
        self.sb=self.ssb.val
        self.xmin_time=dates.num2date(self.sb)-dt.timedelta(minutes=1)
        self.xmax_time=dates.num2date(self.sb)
        self.loadingGraph.axis([self.xmin_time,self.xmax_time,min(self.loadingValueRange), max(self.loadingValueRange)])
        fig.canvas.draw_idle()

    #Define the pause button function
    def setpause(self,event):
        global pause
        pause = not pause
        print(pause)

    #Turn off the ion and show the plot.
    def close(self):
        plt.ioff()
        plt.show()


######################Data Part############################

def verificationcode():
    ##Test if the verification page exists or not
    key = input("Please input your verfication code:")
    if driver.find_element_by_id("smc"):
        verification = driver.find_element_by_id("smc")
        verification.send_keys(key)
        # if driver.find_element_by_id("emc"):
        #     emailverification = driver.find_element_by_id("emc")
        #     emailverification.send_keys(key)
    driver.find_element_by_id("save").click()

def Getdata():

    driver.get(source)

    try:
        driver.find_element_by_id("Login").click()
    except NoSuchElementException:
        print("Don't find the login button")

    while not driver.find_elements_by_id("cas2_ilecell"):
        if driver.find_elements_by_id("smc"):
            for i in range(1, 4):
                try:
                    verificationcode()
                    if driver.find_elements_by_id("smc-error"):
                        verificationcode()
                    else:
                        break
                except IOError:
                    break
        elif driver.find_elements_by_id("editPage"):
            print("Too much tries, please try it later")
            driver.quit()
    else:
        # print("Welcome")
        while True:
            try:

                navigationStart = driver.execute_script("return window.performance.timing.navigationStart")
                # domComplete = driver.execute_script("return window.performance.timing.domComplete")
                loadEvent = driver.execute_script("return window.performance.timing. loadEventEnd")
                onloadPerformance = loadEvent - navigationStart
                dtime = datetime.now().strftime("%m-%d %H:%M:%S")
                # print(dtime, ",", onloadPerformance, "ms")
                yield dtime,onloadPerformance

                time.sleep(2)
                driver.refresh()

            except TimeoutException:
                print("It took too long")
                break
        driver.quit()


# timelist = ['08-31 11:17:27', '08-31 11:17:34', '08-31 11:17:41', '08-31 11:18:27',
#             '08-31 11:18:47', '08-31 11:19:47','08-31 11:19:49']
# onloadlist = ['25032', '6558', '383', '3383', '1111', '2345','5000']

if __name__ == '__main__':
    # Get the local user name
    u = getpass.getuser()

    # # initialize Chrome options
    chrome_options = Options()
    # chrome_options.add_argument('--headless')

    chrome_options.add_argument('user-data-dir=C:\\Users\\%s\\AppData\\Local\\Google\\Chrome\\User Data' % (u))

    # chrome_driver_binary="E:\MyDownloads\Download\chromedriver.exe"
    source = "https://na66.salesforce.com/5000y00001SgXm0?srPos=0&srKp=500"
    driver = webdriver.Chrome(chrome_options=chrome_options)

    # Use the graph class
    graph = streamDetectionPlot()
    graph.initPlot()
    pause = False

    # Dynamic Test
    for times,values in Getdata():
        graph.DetectionPlot(times,values)

    # If timelist and onloadlist is not "#", you can use the following to do the static test.
    # for i in range(len(timelist)):
    #     graph.DetectionPlot(timelist[i], onloadlist[i])

    graph.close()
谢谢看到最后,希望对你有帮助。