目录
一步一步教你写股票走势图——分时图一(概述)
一步一步教你写股票走势图——分时图二(自定义xy轴)
一步一步教你写股票走势图——分时图三(对齐图表、自定义柱状图高亮)
一步一步教你写股票走势图——分时图四(高亮联动)
一步一步教你写股票走势图——分时图五(自定义标记)
一步一步教你写股票走势图——K线图一(概述)
一步一步教你写股票走势图——K线图二(图表联动)
一步一步教你写股票走势图——K线图三(添加均线)
一步一步教你写股票走势图——K线图四(高亮联动一)
一步一步教你写股票走势图——K线图五(高亮联动二)
一步一步教你写股票走势图——商业版
demo更新地址https://github.com/AndroidJiang/StockChart
分时图开发到现在,基本已经完成了,这部分开发完,就会开始着手k线图部分的开发。于是我们做了最后的对比,看下还有什么地方需要增加修改,最后发现,还有标记视图没有,先看下什么是标记视图(博主不知道这个名字叫啥,自己起的):
我们可以看到高亮线的左右两边分别标记了y轴的左右两边的数据, 而且左右滑动的时候,他们位置会随着交界点的变化而变。
本节将会介绍下如何去自定义左右两个标记,相信小伙伴们理解之后,中间的白点也是可以自己任意添加的,不妨在本篇结束后,自己动手试一试!
好了,我们开始本章节的内容吧!
相信有的小伙伴们在刚使用MP这个库的时候,一定见过如下的东东:
没错,这就是标记视图,选中某条数据的情况下,出现的视图,我们就仿照它就没错。
看源码
MarkerView
public abstract class MarkerView extends RelativeLayout {

    /**
     * Constructor. Sets up the MarkerView with a custom layout resource.
     *
     * @param context
     * @param layoutResource the layout resource to use for the MarkerView
     */
    public MarkerView(Context context, int layoutResource) {
        super(context);
        setupLayoutResource(layoutResource);
    }

    /**
     * Sets the layout resource for a custom MarkerView.
     *
     * @param layoutResource
     */
    private void setupLayoutResource(int layoutResource) {

        View inflated = LayoutInflater.from(getContext()).inflate(layoutResource, this);

        inflated.setLayoutParams(new LayoutParams(LayoutParams.WRAP_CONTENT, LayoutParams.WRAP_CONTENT));
        inflated.measure(MeasureSpec.makeMeasureSpec(0, MeasureSpec.UNSPECIFIED), MeasureSpec.makeMeasureSpec(0, MeasureSpec.UNSPECIFIED));

        // measure(getWidth(), getHeight());
        inflated.layout(0, 0, inflated.getMeasuredWidth(), inflated.getMeasuredHeight());
    }

    /**
     * Draws the MarkerView on the given position on the screen with the given Canvas object.
     *
     * @param canvas
     * @param posx
     * @param posy
     */
    public void draw(Canvas canvas, float posx, float posy) {

        // take offsets into consideration
        posx += getXOffset(posx);
        posy += getYOffset(posy);

        // translate to the correct position and draw
        canvas.translate(posx, posy);
        draw(canvas);
        canvas.translate(-posx, -posy);
    }

    /**
     * This method enables a specified custom MarkerView to update it's content everytime the MarkerView is redrawn.
     *
     * @param e         The Entry the MarkerView belongs to. This can also be any subclass of Entry, like BarEntry or
     *                  CandleEntry, simply cast it at runtime.
     * @param highlight the highlight object contains information about the highlighted value such as it's dataset-index, the
     *                  selected range or stack-index (only stacked bar entries).
     */
    public abstract void refreshContent(Entry e, Highlight highlight);

    /**
     * Use this to return the desired offset you wish the MarkerView to have on the x-axis. By returning -(getWidth() /
     * 2) you will center the MarkerView horizontally.
     *
     * @param xpos the position on the x-axis in pixels where the marker is drawn
     * @return
     */
    public abstract int getXOffset(float xpos);

    /**
     * Use this to return the desired position offset you wish the MarkerView to have on the y-axis. By returning
     * -getHeight() you will cause the MarkerView to be above the selected value.
     *
     * @param ypos the position on the y-axis in pixels where the marker is drawn
     * @return
     */
    public abstract int getYOffset(float ypos);
}
构造函数中要传入显示的布局文件,draw会根据传入的position定位,refreshContent更新里面的文本。源码读起来很简单,只有几个方法而已,我们在实例的时候只需传入我们的布局即可,于是我们模仿了一个写法:
public class MyMarkerView extends MarkerView {
private TextView markerTv;
public MyMarkerView(Context context, int layoutResource) {
super(context, layoutResource);
markerTv = (TextView) findViewById(R.id.marker_tv);
}
@Override
public void refreshContent(Entry e, Highlight highlight) {
}
@Override
public int getXOffset(float xpos) {
return 0;
}
@Override
public int getYOffset(float ypos) {
return 0;
}
}
……
private void setMarkerView(){
MyMarkerView myMarkerView = new MyMarkerView(MinutesActivity.this, R.layout.mymarkerview);
lineChart.setMarkerView(myMarkerView);
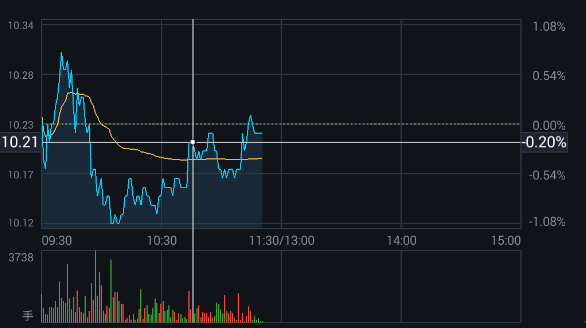
}最后图表进行设置markerview,我们看下效果图:
问题:
- 位置不对,默认只有一个,要显示两个标记
触摸柱状图时,上面不显示标记
MrrkerView自身偏离Offset完成不了这样的需求,那么我们只能从表的重写入手了。
在MyLineChart中重写drawMarkerw方法
public void setHighlightValue(Entry e, Highlight h) {
        this.e = e;
        if (mData == null)
            mIndicesToHighlight = null;
        else {
            mIndicesToHighlight = new Highlight[]{
                    h};
        }
        invalidate();
    }
  @Override
    protected void drawMarkers(Canvas canvas) {
          if (!mDrawMarkerViews || !valuesToHighlight())
            return;
        for (int i = 0; i < mIndicesToHighlight.length; i++) {
            Highlight highlight = mIndicesToHighlight[i];
            int xIndex = mIndicesToHighlight[i].getXIndex();
            int dataSetIndex = mIndicesToHighlight[i].getDataSetIndex();
            float deltaX = mXAxis != null
                    ? mXAxis.mAxisRange
                    : ((mData == null ? 0.f : mData.getXValCount()) - 1.f);
            if (xIndex <= deltaX && xIndex <= deltaX * mAnimator.getPhaseX()) {
                Entry e = mData.getEntryForHighlight(mIndicesToHighlight[i]);
                // make sure entry not null
                if (e == null || e.getXIndex() != mIndicesToHighlight[i].getXIndex())
                    continue;
                float[] pos = getMarkerPosition(e, highlight);
                // check bounds
                if (!mViewPortHandler.isInBounds(pos[0], pos[1]))
                    continue;

                float yValForXIndex1 = minuteHelper.getDatas().get(mIndicesToHighlight[i].getXIndex()).cjprice;
                float yValForXIndex2 = minuteHelper.getDatas().get(mIndicesToHighlight[i].getXIndex()).per;

                myMarkerViewLeft.setData(yValForXIndex1);
                myMarkerViewRight.setData(yValForXIndex2);
                myMarkerViewLeft.refreshContent(e, mIndicesToHighlight[i]);
                myMarkerViewRight.refreshContent(e, mIndicesToHighlight[i]);
                /*修复bug*/
                // invalidate();
                /*重新计算大小*/
                myMarkerViewLeft.measure(MeasureSpec.makeMeasureSpec(0, MeasureSpec.UNSPECIFIED),
                        MeasureSpec.makeMeasureSpec(0, MeasureSpec.UNSPECIFIED));
                myMarkerViewLeft.layout(0, 0, myMarkerViewLeft.getMeasuredWidth(),
                        myMarkerViewLeft.getMeasuredHeight());
                myMarkerViewRight.measure(MeasureSpec.makeMeasureSpec(0, MeasureSpec.UNSPECIFIED),
                        MeasureSpec.makeMeasureSpec(0, MeasureSpec.UNSPECIFIED));
                myMarkerViewRight.layout(0, 0, myMarkerViewRight.getMeasuredWidth(),
                        myMarkerViewRight.getMeasuredHeight());

                myMarkerViewLeft.draw(canvas, mViewPortHandler.contentLeft() - myMarkerViewLeft.getWidth(), pos[1] - myMarkerViewLeft.getHeight() / 2);
                myMarkerViewRight.draw(canvas, mViewPortHandler.contentRight(), pos[1] - myMarkerViewRight.getHeight() / 2);
            }
        }

    }
然后在activity中
 private void setMarkerView(MinuteHelper mData){
        MyLeftMarkerView leftMarkerView = new MyLeftMarkerView(MinutesActivity.this, R.layout.mymarkerview);
        MyRightMarkerView rightMarkerView = new MyRightMarkerView(MinutesActivity.this, R.layout.mymarkerview);
        lineChart.setMarker(leftMarkerView, rightMarkerView, mData);
    }
同时图表的选中也得进行修改传入参数
lineChart.setOnChartValueSelectedListener(new OnChartValueSelectedListener() {
@Override
public void onValueSelected(Entry e, int dataSetIndex, Highlight h) {
barChart.highlightValues(new Highlight[]{h});
lineChart.setHighlightValue(e,h);
}
@Override
public void onNothingSelected() {
}
});
barChart.setOnChartValueSelectedListener(new OnChartValueSelectedListener() {
@Override
public void onValueSelected(Entry e, int dataSetIndex, Highlight h) {
// barChart.highlightValues(new Highlight[]{h});
lineChart.setHighlightValue(e, new Highlight(h.getXIndex(),0));//此函数已经返回highlightBValues的变量,并且刷新,故上面方法可以注释
// barChart.setHighlightValue(h);
}
@Override
public void onNothingSelected() {
}
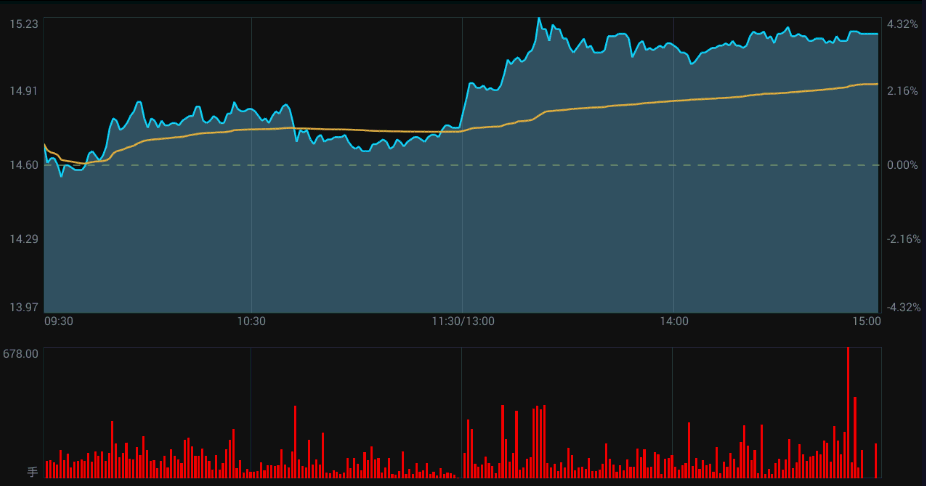
});看得比较乱的同学,可以直接查看demo代码,这里只是简单的放出代码而已,逻辑上估计还有点乱。博主不得不承认,在处理自定义标记的部分代码写的有点渣,中间碰到很多坑,最后也是碰巧实现了效果,博主很纳闷,为啥要从activity中传入Entry的参数才行,而在MyLineChart中直接引用系统的Entry和mData却行不通,希望哪位大神研究后能给出答案,或者在处理自定义标记这边有更好见解的欢迎留言或者联系我。下面我们看下效果图吧(考虑到是仿照自选股app,所以颜色上也基本参考了它):
(注:以上bug,6.17日已修复,上面代码已替换最新)
总结:分时图写到这里基本告一段落了,大概的功能也都能实现了,如果有什么问题,请留言,博主一定尽力解决,同时发现demo有bug啥的或者更好的处理方式,也欢迎联系我。端午后将会更新大家期待已久的K线图,欢迎大家star我的项目https://github.com/AndroidJiang/StockChart,最后祝大家端午快乐!。
目录
一步一步教你写股票走势图——分时图一(概述)
一步一步教你写股票走势图——分时图二(自定义xy轴)
一步一步教你写股票走势图——分时图三(对齐图表、自定义柱状图高亮)
一步一步教你写股票走势图——分时图四(高亮联动)
一步一步教你写股票走势图——分时图五(自定义标记)
一步一步教你写股票走势图——K线图一(概述)
一步一步教你写股票走势图——K线图二(图表联动)
一步一步教你写股票走势图——K线图三(添加均线)
一步一步教你写股票走势图——K线图四(高亮联动一)
一步一步教你写股票走势图——K线图五(高亮联动二)
一步一步教你写股票走势图——商业版
demo更新地址https://github.com/AndroidJiang/StockChart