数据集是从UCI中找的,是对乳腺癌病的预测判断的示例
import pandas as pd
from sklearn.preprocessing import LabelEncoder
from sklearn.cross_validation import train_test_split
from sklearn.preprocessing import StandardScaler
from sklearn.pipeline import Pipeline
from sklearn.svm import SVC
import numpy as np
from sklearn.metrics import confusion_matrix
import matplotlib.pyplot as plt
from sklearn.metrics import precision_score,recall_score,f1_score
file = pd.read_csv("http://archive.ics.uci.edu/ml/machine-learning-databases/breast-cancer-wisconsin/wdbc.data",header=None)
df = file
X = df.loc[:, 2:].values
y = df.loc[:, 1].values
le = LabelEncoder()
y = le.fit_transform(y)#类标整形化
#划分训练集和测试集
X_train,X_test,y_train,y_test = train_test_split(X, y, test_size=0.20,random_state=1)
#建立pipeline
pipe_svc = Pipeline([("scl",StandardScaler()),("clf",SVC(random_state=1))])
pipe_svc.fit(X_train,y_train)
y_pred = pipe_svc.predict(X_test)
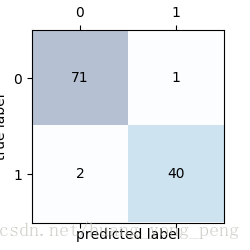
# 混淆矩阵并可视化
confmat = confusion_matrix(y_true=y_test, y_pred=y_pred) # 输出混淆矩阵
print(confmat)
fig, ax = plt.subplots(figsize=(2.5, 2.5))
ax.matshow(confmat, cmap=plt.cm.Blues, alpha=0.3)
for i in range(confmat.shape[0]):
for j in range(confmat.shape[1]):
ax.text(x=j, y=i, s=confmat[i, j], va="center", ha="center")
plt.xlabel("predicted label")
plt.ylabel('true label')
plt.savefig('shuju8')
plt.show()
# 召回率,准确率,F1
print("precision:%.3f" % precision_score(y_true=y_test, y_pred=y_pred))
print("recall:%.3f" % recall_score(y_true=y_test, y_pred=y_pred))
print("F1:%.3f" % f1_score(y_true=y_test, y_pred=y_pred))运行结果是:
[[71 1]
[ 2 40]]
precision:0.976
recall:0.952
F1:0.964
其中左边是测试集预测有病的一共73个数据,猜对了71个2个猜错了,右边是预测没病的猜错了1个,猜对了40个。