版权声明:本文为博主原创文章,未经博主允许不得转载。 https://blog.csdn.net/iracer/article/details/51232222
This series of articles are the study notes of " Machine Learning ", by Prof. Andrew Ng., Stanford University. This article is the notes of week 6, Advice for Applying Machine Learning. This article contains some topic about how to evaluating a hypothesis
Advice for Applying Machine Learning
By now we have seen a lot of different learning algorithms. And if you've been following along these videos you should consider yourself an expert on many state-of-the-art machine learning techniques. But even among people that know a certain learning algorithm. There's often a huge difference between someone that really knows how to powerfully and effectively apply that algorithm, versus someone that's less familiar with some of the material that I'm about to teach and who doesn't really understand how to apply these algorithms and can end up wasting a lot of their time trying things out that don't really make sense. What I would like to do is make sure that if you are developing machine learning systems, that you know how to choose one of the most promising avenues to spend your time pursuing.
1. Deciding What to Try Next
Debugging a learning algorithm
And on this and the next few videos I'm going to give a number of practical suggestions, advice, guidelines on how to do that.
And concretely what we'd focus on is the problem of, suppose you are developing a machine learning system or trying to improve the performance of a machine learning system, how do you go about deciding what are the proxy avenues to try next? To explain this, let's continue using
our example of learning to predict housing prices.
And let's say you've implement and regularize linear regression. Thus minimizing that cost function j.
Now suppose that after you take your learn parameters,if you test your hypothesis on the new set of houses, suppose you find that this is making huge errors in this prediction of the housing prices.
What should you then try next in order to improve the learning algorithm?
There are many things that one can think of that could improve the performance of the learning algorithm.
- Get more training examples
- Try smaller sets of features
- Try getting additional features
- Try adding polynomial features (x1, x2, x1x2, etc)
- Try decreasing λ
- Try increasing λ
(1) One thing they could try, is to get more training examples. And concretely, you can imagine, maybe, you know, setting up phone surveys, going door to door, to try to get more data on how much different houses sell for. And the sad thing is I've seen a lot of people spend a lot of time collecting more training examples, thinking oh, if we have twice as much or ten times as much training data, that is certainly going to help. But sometimes getting more training data doesn't actually help and in the next few videos we will see why, and we will see how you can avoid spending a lot of time collecting more training data in settings where it is just not going to help.
(2) Other things you might try are to well maybe try a smaller set of features. So if you have some set of features such as x1, x2, x3 and so on, maybe a large number of features. Maybe you want to spend time carefully selecting some small subset of them to prevent overfitting.
(3) Or maybe you need to get additional features. Maybe the current set of features aren't informative enough and you want to collect more data in the sense of getting more features. And once again this is the sort of project that can scale up the huge projects can you imagine getting phone surveys to find out more houses, or extra land surveys to find out more about the pieces of land and so on, so a huge project. And once again it would be nice to know in advance if this is going to help before we spend a lot of time doing something like this. We can also try adding polynomial features things like x2 square x2 square and product features x1, x2.
(4) We can still spend quite a lot of time thinking about that and we can also try other things like decreasing lambda, the regularization parameter or increasing lambda.
Given a menu of options like these, some of which can easily scale up to six month or longer projects. Unfortunately, the most common method that people use to pick one of these is to go by god feeling. In which what many people will do is sort of randomly pick one of these options and maybe say, "Oh, lets go and get more training data." And easily spend six months collecting more training data or maybe someone else would rather be saying, "Well, let's go collect a lot more features on these houses in our data set." And I have a lot of times, sadly seen people spend, you know, literally 6 months doing one of these avenues that they have sort of at random only to discover six months later that that really wasn't a promising avenue to pursue.
Machine learning diagnostic
Fortunately, there is a pretty simple technique that can let you very quickly rule out half of the things on this list as being potentially promising things to pursue. And there is a very simple technique, that if you run, can easily rule out many of these options, and potentially save you a lot of time pursuing something that's just is not going to work. In the next two videos after this, I'm going to first talk about how to evaluate learning algorithms. And in the next few videos after that, I'm going to talk about these techniques, which are called the machine learning diagnostics.
Diagnostic: A test that you can run to gain insight what is/isn’t working with a learning algorithm, and gain guidance as to how best to improve its performance.
Diagnostics can take time to implement, but doing so can be a very good use of your time.
2. Evaluating a hypothesis
Evaluating your hypothesis
Hypothesis can overfit
When we fit the parameters of our learning algorithm we think about choosing the parameters to minimize the training error. One might think that getting a really low value of training error might be a good thing, but we have already seen that just because a hypothesis has low training error, that doesn't mean it is necessarily a good hypothesis. And we've already seen
the example of how a hypothesis can overfit. And therefore
fail to generalize the new examples not in the training set.
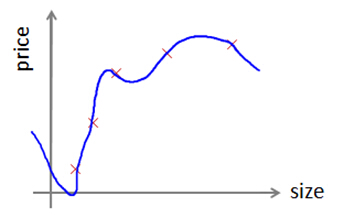
How do you tell if the hypothesis might be overfitting
So how do you tell if the hypothesis might be overfitting. In this simple example we could plot the hypothesis h of x and just see what was going on. But in general for problems with more features than just one feature, for problems with a large number of features like these it becomes hard or
may be impossible to plot what the hypothesis looks like and so we need some other way to evaluate our hypothesis.

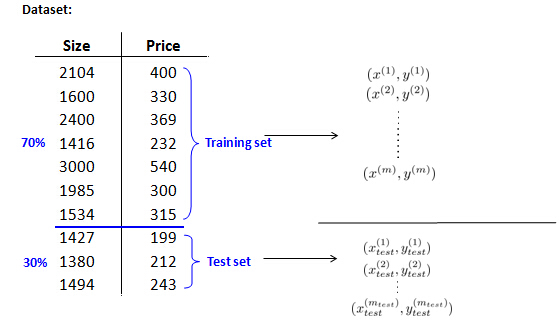
The standard way to evaluate a learned hypothesis is as follows. Suppose we have data set like this. Here I have just shown 10 training examples, but of course usually we may have dozens or hundreds or maybe thousands of training examples.
In order to make sure we can evaluate our hypothesis, what we are going to do is split the data we have into two portions. The first portion is going to be our usual training set and the second portion is going to be our test set, and a pretty typical split of this all the data we have into a training set and test set might be around say a 70%, 30% split.
70%, 30% split of the data set
And so now, if we have some data set, we run 70% of the data to be our training set where here "m" is as usual our number of training examples and the remainder of our data might then be assigned to become our test set. And here, I'm going to use the notation m test to denote the number of test examples.
Randomly sort the data set
Finally, one last detail whereas here I've drawn this as though the first 70% goes to the training set and the last 30% to the test set. If there is any sort of ordinary to the data. That should be better to send a random 70% of your data to the training set and a random 30% of your data to the test set. So if your data were already randomly sorted, you could just take the first 70% and last 30% that if your data were not randomly ordered, it would be better to randomly shuffle or to randomly reorder the examples in your training set. Before you know sending the first 70% in the training set and the last 30% of the test set.
Training/testing procedure for linear regression
Here then is a fairly typical procedure for how you would train and test the learning algorithm and the learning regression.
Learn parameter θ from training data
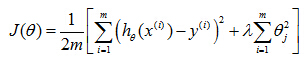
Learn parameter θ from training data (minimizing training errorJ(θ) )
First, you learn the parameters theta from the training set so you minimize the usual training error objective j of theta, where j of theta here was defined using that 70% ofall the data you have. There is only the training data. And then you would compute the test error.
Compute test set error of Linear Regression
And then you would compute the test error. And I am going to denote the test error as j subscript test. And so what you do is take your parameter theta that you have learned from the training set, and plug it in here and compute your test set error. Which I am going to write as follows.

So this is basically the average squared error as measured on your test set. This is the definition of the test set error if we are using linear regression and using the squared error metric.
Training/testing procedure for logistic regression
Learn parameter θ from training data
Learnparameter θ from training data(minimizing training errorJ(θ) )
First, you learn the parameters theta from the training set so you minimize the usual training error objective j of theta, where j of theta here was defined using that 70% of all the data you have. There is only the training data. And then you would compute the test error.
Compute test set error of logistic regression
How about if we were doing a classification problem and say using logistic regression instead.In that case, the procedure for training and testing say logistic regression is pretty similar first we will do the parameters from the training data, that first 70% of the data. And it will compute the test error as follows.
Misclassification error (0/1 misclassification error):
It's the same objective function as we always use but we just logistic regression, except that now is define using our m subscript test. While this definition of the test set error Jtest is perfectly reasonable. Sometimes there is an alternative test sets metric that might be easier to interpret, and that's the misclassification error. It's also called the zero one misclassification error, with zero one denoting that you either get an example right or you get an example wrong.

Here's what I mean. Let me define the error of a prediction. That is h of x. And given the label y as equal to one if my hypothesis outputs the value greater than equal to five and Y is equal to zero or if my hypothesis outputs a value of less than 0.5 and y is equal to one, right, so both of these cases basic respond to if your hypothesis mislabeled the example assuming your threshold at an 0.5. So either thought it was more likely to be 1, but it was actually 0, or your hypothesis stored was more likely to be 0, but the label was actually 1. And otherwise, we define this error function to be zero.
If your hypothesis basically classified the example y correctly. We could then define the test error, using the misclassification error metric to be one of the m tests of sum from i equals one to m subscript test of the error of h of x(i) test comma y(i). And so that's just my way of writing out that this is exactly the fraction of the examples in my test set that my hypothesis has mislabeled. And so that's the definition of the test set error using the misclassification error of the 0/1 misclassification metric.