机器学习面试题的分类
- The first really has to do with the algorithms and theory behind machine learning. You’ll have to show an understanding of how algorithms compare with one another and how to measure their efficacy and accuracy in the right way.
- The second category has to do with your programming skills and your ability to execute on top of those algorithms and the theory.
- The third has to do with your general interest in machine learning: you’ll be asked about what’s going on in the industry and how you keep up with the latest machine learning trends.
- Finally, there are company or industry-specific questions that test your ability to take your general machine learning knowledge and turn it into actionable points to drive the bottom line forward.
如何权衡偏差与方差?
More reading: Bias-Variance Tradeoff (Wikipedia)
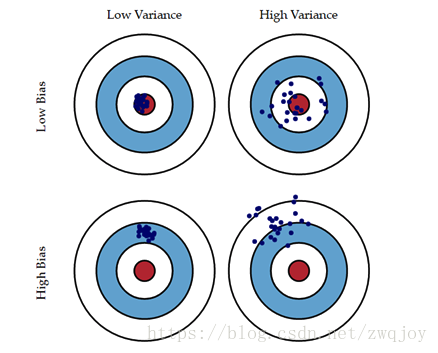
Bias is error due to erroneous or overly simplistic assumptions in the learning algorithm you’re using. This can lead to the model underfitting your data, making it hard for it to have high predictive accuracy and for you to generalize your knowledge from the training set to the test set.
Variance is error due to too much complexity in the learning algorithm you’re using. This leads to the algorithm being highly sensitive to high degrees of variation in your training data, which can lead your model to overfit the data. You’ll be carrying too much noise from your training data for your model to be very useful for your test data.
The bias-variance decomposition essentially decomposes the learning error from any algorithm by adding the bias, the variance and a bit of irreducible error due to noise in the underlying dataset. Essentially, if you make the model more complex and add more variables, you’ll lose bias but gain some variance — in order to get the optimally reduced amount of error, you’ll have to tradeoff bias and variance. You don’t want either high bias or high variance in your model.

- 随着模型变复杂,Bias导致的error下降;
- 随着模型变复杂,Variance导致的error上升;
- 随着模型变复杂,error由下降到上升。
- 模型较简单时,大的Bias,小的Variance,Underfitting!
- 模型过于复杂时,小的Bias,大的Variance,Overfitting!
Bias:度量了学习算法的期望输出与真实结果的偏离程度, 刻画了算法的拟合能力,Bias 偏高表示预测函数与真实结果差异很大。
Variance:则代表“同样大小的不同的训练数据集训练出的模型”与“这些模型的期望输出值”之间的差异。训练集变化导致性能变化, Variance 偏高表示模型很不稳定。
最后谈一下 K-fold Cross Validation 与权衡 Bais-Variance 之间的关系。这个理解其实很简单,先看对于数据的划分“

k-fold交叉验证常用来确定不同类型的模型(线性、指数等)哪一种更好,为了减少数据划分对模型评价的影响,最终选出来的模型类型(线性、指数等)是k次建模的误差平均值最小的模型。
当k较大时,经过更多次数的平均可以学习得到更符合真实数据分布的模型,Bias就小了,但是这样一来模型就更加拟合训练数据集,再去测试集上预测的时候预测误差的期望值就变大了,从而Variance就大了;
反之,k较小时模型不会过度拟合训练数据,从而Bias较大,但是正因为没有过度拟合训练数据,Variance也较小。
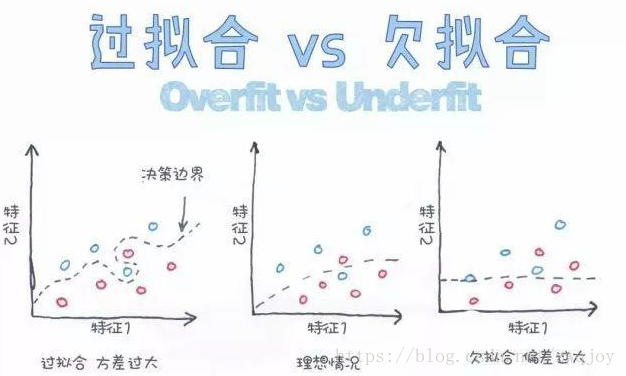
过拟合原因
数据:数据不规范,数据量少,数据泄露,统计特征用到了未来的信息或者标签信息
算法:算法过于复杂
解决:
1、将数据规范化,处理缺失值,增加数据量,采样,添加噪声数据
2、正则化,控制模型复杂程度,
3、early stoping,减少迭代次数,减少树的深度,
4、学习率调大/小点、
5、融合几个模型
KNN和K-Means的区别 ?
More reading: How is the k-nearest neighbor algorithm different from k-means clustering? (Quora)
K-Nearest Neighbors is a supervised classification algorithm, while k-means clustering is an unsupervised clustering algorithm. While the mechanisms may seem similar at first, what this really means is that in order for K-Nearest Neighbors to work, you need labeled data you want to classify an unlabeled point into (thus the nearest neighbor part). K-means clustering requires only a set of unlabeled points and a threshold: the algorithm will take unlabeled points and gradually learn how to cluster them into groups by computing the mean of the distance between different points.
The critical difference here is that KNN needs labeled points and is thus supervised learning, while k-means doesn’t — and is thus unsupervised learning.
| KNN |
K-Means |
| 目的是为了确定一个点的分类 |
目的是为了将一系列点集分成k类 |
| 1.KNN是分类算法 2.监督学习,分类目标事先已知 3.喂给它的数据集是带label的数据,已经是完全正确的数据 |
1.K-Means是聚类算法 2.非监督学习 3.喂给它的数据集是无label的数据,是杂乱无章的,经过聚类后才变得有点顺序,先无序,后有序 |
| 没有明显的前期训练过程,属于memory-based learning | 有明显的前期训练过程 |
| K的含义:来了一个样本x,要给它分类,即求出它的y,就从数据集中,在x附近找离它最近的K个数据点,这K个数据点,类别c占的个数最多,就把x的label设为c | K的含义:K是人工固定好的数字,假设数据集合可以分为K个簇,由于是依靠人工定好,需要一点先验知识 |
| K值确定后每次结果固定 |
K值确定后每次结果可能不同,从 n个数据对象任意选择 k 个对象作为初始聚类中心,随机性对结果影响较大 |
| 相似点:都包含这样的过程,给定一个点,在数据集中找离它最近的点。即二者都用到了NN(Nears Neighbor)算法,一般用KD树来实现NN。 |
|
理解准确率(accuracy)、精度(precision)、查全率(recall)、F1
More reading: Precision and recall (Wikipedia)
Recall is also known as the true positive rate: the amount of positives your model claims compared to the actual number of positives there are throughout the data. Precision is also known as the positive predictive value, and it is a measure of the amount of accurate positives your model claims compared to the number of positives it actually claims. It can be easier to think of recall and precision in the context of a case where you’ve predicted that there were 10 apples and 5 oranges in a case of 10 apples. You’d have perfect recall (there are actually 10 apples, and you predicted there would be 10) but 66.7% precision because out of the 15 events you predicted, only 10 (the apples) are correct.
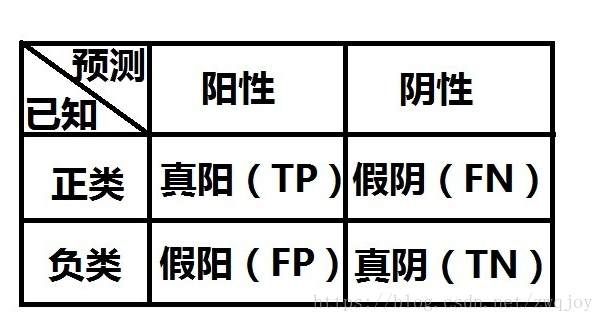
- 预测值为正例,记为P(Positive)
- 预测值为反例,记为N(Negative)
- 预测值与真实值相同,记为T(True)
- 预测值与真实值相反,记为F(False)
(1) 真阳性(True Positive,TP):检测有结节,且实际有结节;正确肯定的匹配数目;
(2) 假阳性(False Positive,FP):检测有结节,但实际无结节;误报,给出的匹配是不正确的;
(3) 真阴性(True Negative,TN):检测无结节,且实际无结节;正确拒绝的非匹配数目;
(4) 假阴性(False Negative,FN):检测无结节,但实际有结节;漏报,没有正确找到的匹配的数目。
反映的是分类器准确识别真阳性和假阴性的比率。看起来似乎这个指标已经能反映一个分类器的性能了,但我们应当想起一个很重的前提:这个ACC是只针对目前输入的这一组数据做出的判断。这就很容易因为数据偏斜造成模型的“测不准”。
准确率P、召回率R、F1 值
- 准确率 (Accuracy):(TP+TN)/(TP+TN+FP+FN) 通俗地讲, (预测正确的样本数)/(总样本数)
- 精度 (Precision 查准率):P=TP/(TP+FP)。 通俗地讲,就是预测正确的正例数据占预测为正例数据的比例。
- 召回率(Recall 查全率): R=TP/(TP+FN)。 通俗地讲,就是预测为正例的数据占实际为正例数据的比例
- F1值(F score):
分类阈值对Precision/Recall的影响
做二值分类时,我们认为,若h(x)>=0.5,则predict=1;若h(x)<0.5,则predict=0。这里0.5就是分类阈值。
增加阈值,我们会对预测值更有信心,即增加了查准率。但这样会降低查全率。(High Precision, Low Recall)
减小阈值,则模型放过的真例就变少,查全率就增加。(Low Precision, High Recall)
解释下ROC 和AUC ?
More reading: Receiver operating characteristic (Wikipedia)
The ROC curve is a graphical representation of the contrast between true positive rates and the false positive rate at various thresholds. It’s often used as a proxy for the trade-off between the sensitivity of the model (true positives) vs the fall-out or the probability it will trigger a false alarm (false positives).
ROC曲线是用来验证一个分类器(二分)模型的性能的。其工作原理是,给出一个模型,输入已知正负类的一组数据,并通过对比模型对该组数据进行的预测,衡量这个模型的性能。
注意,“测试数据”的正负类是已知的,我们需要的是判断模型预测数据的阳性、阴性是否符合“测试数据”的事实。
>ROC曲线是怎么画的呢?
- 给定一个初始阈值(一半是从0%开始)
- 根据分类结果画上图中第一个表格,然后根据上面的式子算出TPR和FPR。由TPR和FPR可以确定一个点,在图中画出;
- 给一个新的阈值(如每次加1%),并重复步骤2、3,直到阈值取到100%。
- 若干个点最后组成了ROC曲线。

AUC(Area Under Curve),是对ROC曲线的量化指标。
一个合适的分类器,要求做到TPR较高而FPR较小,体现在曲线上,就是在相同的FPR时,TPR越大的越好:
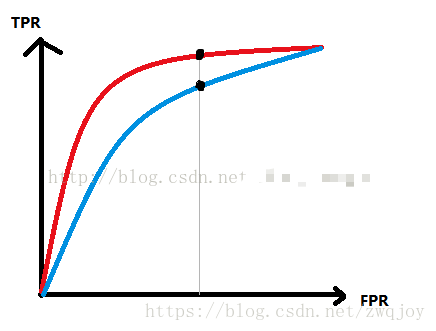
如上图中,红线对应的分类器的性能就好过蓝线对应的分类器。
但对于人类来说,通过人眼识别自然很简单。但对于计算机呢?而且,某些情况下,ROC曲线并不一定是完全光滑的(由于阈值取值的问题等),有可能某一个时刻红线超过了蓝线而另一个时刻蓝线超过了红线,这就很难进行判断到底哪个分类器性能好。
所以我们用AUC进行评价。AUC的值,等于曲线与FPR轴线形成的面积。AUC的值越大越好,其取值范围为(0.5,1)
What is Bayes’ Theorem? How is it useful in a machine learning context?
More reading: An Intuitive (and Short) Explanation of Bayes’ Theorem (BetterExplained)
Bayes’ Theorem gives you the posterior probability of an event given what is known as prior knowledge.
Mathematically, it’s expressed as the true positive rate of a condition sample divided by the sum of the false positive rate of the population and the true positive rate of a condition. Say you had a 60% chance of actually having the flu after a flu test, but out of people who had the flu, the test will be false 50% of the time, and the overall population only has a 5% chance of having the flu. Would you actually have a 60% chance of having the flu after having a positive test?
Bayes’ Theorem says no. It says that you have a (.6 * 0.05) (True Positive Rate of a Condition Sample) / (.6*0.05)(True Positive Rate of a Condition Sample) + (.5*0.95) (False Positive Rate of a Population) = 0.0594 or 5.94% chance of getting a flu.
Bayes’ Theorem is the basis behind a branch of machine learning that most notably includes the Naive Bayes classifier. That’s something important to consider when you’re faced with machine learning interview questions.
为什么朴素贝叶斯如此“朴素”?
More reading: Why is “naive Bayes” naive? (Quora)
因为它假定所有的特征在数据集中的作用是同样重要和独立的。正如我们所知,这个假设在现实世界中是很不真实的,因此,说朴素贝叶斯真的很“朴素”。
naive(朴素)是指的对于模型中各个 feature(特征) 有强独立性的假设,并未将 feature 间的相关性纳入考虑中。
朴素贝叶斯分类器一个比较著名的应用是用于对垃圾邮件分类,通常用文字特征来识别垃圾邮件,是文本分类中比较常用的一种方法。
什么是正则化, 为什么要正则化? 请给出一些正则化常用方法。
More reading: What is the difference between L1 and L2 regularization? (Quora)

从贝叶斯的角度来看,加入正则项相当于加入了一种先验。即当训练一个模型时,仅依靠当前的训练数据集是不够的,为了实现更好的泛化能力,往往需要加入先验项。
L1范数相当于加入了一个Laplacean先验(拉普拉斯分布); L2范数相当于加入了一个Gaussian先验。
- L1是Lasso Regression,表示向量中每个元素绝对值的和:L1范数的解通常是稀疏性的,倾向于选择数目较少的一些非常大的值或者数目较多的insignificant的小值。
- L2是岭回归,Ridge Regression,是欧氏距离也就是平方和的平方根。L2范数越小,可以使得w的每个元素都很小,接近于0,但L1范数不同的是他不会让它等于0而是接近于0。
- L1正则化的w可取的值是转置的方形,L2对应的是圆形。这样损失函数l(w)的最小值更容易在L1对应的边角上取得,从而这些维度变成0了。
- L2对大数的惩罚更大,但是解相对来说比较均匀。
数据规范化是什么? 为什么需要对数据进行规范化?
数据规范化在预处理阶段尤为重要,它可以将数值缩放到特定的范围,以在反向传播时获得更好的收敛性。一般而言,规范化就是让每一个数据点减去它们的均值,并除以标准差。
如果不这样处理,一些(数量级较大的)特征值在代价函数中的权重就会更大(如果大数量级特征值改变1%,代价函数的变化就会很大,但小数量级的特征值改变1%产生的影响则微乎其微)。规范化使得所有特征值具有相同的权重。
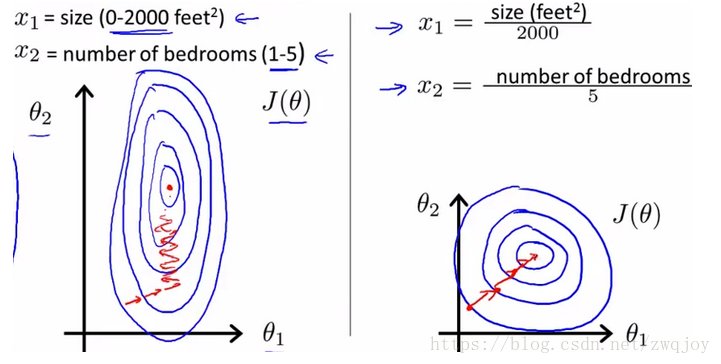
1)归一化后加快了梯度下降求最优解的速度
如下图所示,蓝色的圈圈图代表的是两个特征的等高线。其中左图两个特征X1和X2的区间相差非常大,X1区间是[0,2000],X2区间是[1,5],其所形成的等高线非常尖。当使用梯度下降法寻求最优解时,很有可能走“之字型”路线(垂直等高线走),从而导致需要迭代很多次才能收敛;
而右图对两个原始特征进行了归一化,其对应的等高线显得很圆,在梯度下降进行求解时能较快的收敛。 因此如果机器学习模型使用梯度下降法求最优解时,归一化往往非常有必要,否则很难收敛甚至不能收敛。
2)归一化有可能提高精度。
一些分类器需要计算样本之间的距离(如欧氏距离),例如KNN。如果一个特征值域范围非常大,那么距离计算就主要取决于这个特征,从而与实际情况相悖(比如这时实际情况是值域范围小的特征更重要)。
3)哪些机器学习算法不需要做归一化处理?
概率模型不需要归一化,因为它们不关心变量的值,而是关心变量的分布和变量之间的条件概率,如决策树、RF。而像Adaboost、GBDT、XGBoost、SVM、LR、KNN、KMeans之类的最优化问题就需要归一化。
1)线性归一化
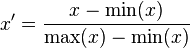
这种归一化方法比较适用在数值比较集中的情况。这种方法有个缺陷,如果max和min不稳定,很容易使得归一化结果不稳定,使得后续使用效果也不稳定。实际使用中可以用经验常量值来替代max和min。
2)标准差标准化
经过处理的数据符合标准正态分布,即均值为0,标准差为1,其转化函数为:

其中μ为所有样本数据的均值,σ为所有样本数据的标准差。
3)非线性归一化
经常用在数据分化比较大的场景,有些数值很大,有些很小。通过一些数学函数,将原始值进行映射。该方法包括 log、指数,正切等。需要根据数据分布的情况,决定非线性函数的曲线,比如log(V, 2)还是log(V, 10)等。
What’s the difference between Type I and Type II error?
More reading: Type I and type II errors (Wikipedia)
Don’t think that this is a trick question! Many machine learning interview questions will be an attempt to lob basic questions at you just to make sure you’re on top of your game and you’ve prepared all of your bases.
Type I error is a false positive, while Type II error is a false negative. Briefly stated, Type I error means claiming something has happened when it hasn’t, while Type II error means that you claim nothing is happening when in fact something is.
A clever way to think about this is to think of Type I error as telling a man he is pregnant, while Type II error means you tell a pregnant woman she isn’t carrying a baby.
Type I error 是指统计学中的一类错误,意思是本来是错误的结论却被接受了。Type II error 是指统计学中的二类错误,也就是本来是正确的错误却被拒绝了。简而言之,就是存伪和弃真。
第一类错误是指:原假设事实上正确,可是检验统计量的观测值却落入拒绝域, 因而否定了本来正确的假设.这是弃真的错误, 为了降低第一类错误的概率,就要尽可能的做接受的推断,随之带来的就是可能把假的也当成真的接受了,这就导致纳伪错误的增加,即增加第二类错误发生的概率. 原假设事实上不正确,而检验统计量的观测值却落入了不能拒绝域,因而没有否定本来不正确的原假设,这是取伪的错误.
这样本容量固定的前提下,两类错误的概率不能同时减少.为了同时减少两类错误的概率就得增加样本容量.
What’s a Fourier transform?
More reading: Fourier transform (Wikipedia)
A Fourier transform is a generic method to decompose generic functions into a superposition of symmetric functions. Or as this more intuitive tutorial puts it, given a smoothie, it’s how we find the recipe. The Fourier transform finds the set of cycle speeds, amplitudes and phases to match any time signal. A Fourier transform converts a signal from time to frequency domain — it’s a very common way to extract features from audio signals or other time series such as sensor data.
图像或声音的数字信号通常在时域上是连续的不具有稀疏性,但经过傅里叶变换、余弦变换、小波变换等处理手段后会转换为频域上的稀疏信号
What’s the difference between probability and likelihood?
More reading: What is the difference between “likelihood” and “probability”? (Cross Validated)
概率(probability)和似然(likelihood),都是指可能性,都可以被称为概率,但在统计应用中有所区别。
概率是给定某一参数值,求某一结果的可能性。例如,抛一枚匀质硬币,抛10次,6次正面向上的可能性多大?
似然是给定某一结果,求某一参数值的可能性。例如,抛一枚硬币,抛10次,结果是6次正面向上,其是匀质的可能性多大?
生成模型和判别模型区别?
More reading: What is the difference between a Generative and Discriminative Algorithm? (Stack Overflow)
A generative model will learn categories of data while a discriminative model will simply learn the distinction between different categories of data. Discriminative models will generally outperform generative models on classification tasks.
判别方法:由数据直接学习决策函数 Y = f(X),或者由条件分布概率 P(Y|X)作为预测模型,即判别模型。
生成方法:由数据学习联合概率密度分布函数 P(X,Y),然后求出条件概率分布P(Y|X)作为预测的模型,即生成模型。
由生成模型可以得到判别模型,但由判别模型得不到生成模型。
常见的判别模型有:K近邻、SVM、决策树、感知机、线性判别分析(LDA)、线性回归、传统的神经网络、逻辑斯蒂回归、boosting、条件随机场
常见的生成模型有:朴素贝叶斯、隐马尔可夫模型、高斯混合模型、文档主题生成模型(LDA)、限制玻尔兹曼机
线性分类器与非线性分类器的区别以及优劣?
如果模型是参数的线性函数,并且存在线性分类面,那么就是线性分类器,否则不是。
常见的线性分类器有:LR,贝叶斯分类,单层感知机、线性回归。
常见的非线性分类器:决策树、RF、GBDT、多层感知机。
SVM两种都有(看线性核还是高斯核)。
线性分类器速度快、编程方便,但是可能拟合效果不会很好。
非线性分类器编程复杂,但是效果拟合能力强。
What cross-validation technique would you use on a time series dataset?
More reading: Using k-fold cross-validation for time-series model selection (CrossValidated)
Instead of using standard k-folds cross-validation, you have to pay attention to the fact that a time series is not randomly distributed data — it is inherently ordered by chronological order. If a pattern emerges in later time periods for example, your model may still pick up on it even if that effect doesn’t hold in earlier years!
You’ll want to do something like forward chaining where you’ll be able to model on past data then look at forward-facing data.
- fold 1 : training [1], test [2]
- fold 2 : training [1 2], test [3]
- fold 3 : training [1 2 3], test [4]
- fold 4 : training [1 2 3 4], test [5]
- fold 5 : training [1 2 3 4 5], test [6]
什么是决策树剪枝?
More reading: Pruning (decision trees)
决策树对训练属于有很好的分类能力,但是对于未知的测试集未必有好的分类能力,泛化能力弱,即可能发生过拟合现象。 决策树是充分考虑了所有的数据点而生成的复杂树,有可能出现过拟合的情况,决策树越复杂,过拟合的程度会越高。为防止过拟合,我们需要进行剪枝。 剪枝修剪分裂前后分类误差相差不大的子树,能够降低决策树的复杂度,降低过拟合出现的概率
Pruning can happen bottom-up and top-down, with approaches such as reduced error pruning and cost complexity pruning.
Reduced error pruning is perhaps the simplest version: replace each node. If it doesn’t decrease predictive accuracy, keep it pruned. While simple, this heuristic actually comes pretty close to an approach that would optimize for maximum accuracy.
剪枝分为预剪枝和后剪枝:
预剪枝:
(1)每一个结点所包含的最小样本数目,例如10,则该结点总样本数小于10时,则不再分;
(2)指定树的高度或者深度,例如树的最大深度为4;
(3)指定结点的熵小于某个值,不再划分。
后剪枝:
总体思路:由完全树T0开始,剪枝部分结点得到T1,再次剪枝部分结点得到T2...直到剩下树根的树Tk;在验证数据集上对这k个树分别评价,选择损失函数最小的树Ta。
Which is more important to you– model accuracy, or model performance?
More reading: Accuracy paradox (Wikipedia)
This question tests your grasp of the nuances of machine learning model performance! Machine learning interview questions often look towards the details. There are models with higher accuracy that can perform worse in predictive power — how does that make sense?
Well, it has everything to do with how model accuracy is only a subset of model performance, and at that, a sometimes misleading one. For example, if you wanted to detect fraud in a massive dataset with a sample of millions, a more accurate model would most likely predict no fraud at all if only a vast minority of cases were fraud. However, this would be useless for a predictive model — a model designed to find fraud that asserted there was no fraud at all! Questions like this help you demonstrate that you understand model accuracy isn’t the be-all and end-all of model performance.
如何处理数据集中缺失或损坏的数据?
你可以在数据集中找到缺失/损坏的数据,并删除它所在的行或列,或是用其他值代替之。
Pandas中有两个非常有效的函数:isnull()和dropna(),这两个函数可以帮你找到有缺失/损坏数据的行,并删除对应值。如果要用占位符(比如0)填充这些无效值,你可以使用fillna()函数。
如何处理不平衡数据集?
More reading: 8 Tactics to Combat Imbalanced Classes in Your Machine Learning Dataset (Machine Learning Mastery)
An imbalanced dataset is when you have, for example, a classification test and 90% of the data is in one class. That leads to problems: an accuracy of 90% can be skewed if you have no predictive power on the other category of data! Here are a few tactics to get over the hump:
1- Collect more data to even the imbalances in the dataset.
2- Resample the dataset to correct for imbalances.
3- Try a different algorithm altogether on your dataset.
What’s important here is that you have a keen sense for what damage an unbalanced dataset can cause, and how to balance that.
Q20 - 如何开展探索性数据分析(EDA)?
EDA的目的是在应用预测模型之前,了解数据的信息,获得对数据的直观感受。总的来说,开展探索性数据分析一般采取由粗到精的方法。
如何开展数据分析
(1)首先获取一些高层次、全局性的直观感受。检查一下不平衡的类,查看每一类的均值和方差。看看第一行,了解数据大致内容。运行pandas中的http://df.info()函数,看看哪些是连续变量、分类变量,并查看变量的数据类型(整型、浮点型、字符串)。然后删掉一些在分析、预测中不需要的列,这些列中的很多行数值都相同(提供的信息也相同),或者存在很多缺失值。我们也可以用某一行/列的众数或中值填充该行/列中的缺失值。
(2)可以做一些基本的可视化操作。从相对高层次、全局性的角度开始,比如绘制分类特征关于类别的条形图,绘制最终类别的条形图,探究一下最“常用”的特征,对独立变量进行可视化以获得一些认知和灵感等。
(3)可以展开更具体的探索。比如同时对两三个特征进行可视化,看看它们相互有何联系。也可以做主成分分析,来确定哪些特征中包含的信息最多。类似地,还可以将一些特征分组,以观察组间联系。
比如可以考察一下,取A = B = 0时,不同的类会有什么表现?取A = 1、B = 0时呢?还要比较一下不同特征的影响,比方说特征A可以取“男性”或“女性”,则可以画出特征A与旅客舱位的关系图,判断男性和女性选在舱位选择上是否有差异。
除了条形图、散点图或是其他基本图表,也可以画出PDF(概率分布函数)或CDF(累计分布函数)、使用重叠绘图方法等。还可以考察一下统计特性,比如分布、p值等。最后就该建立机器学习模型了。
从简单的模型开始,比如朴素贝叶斯、线性回归等。如果上述模型效果不理想,或是数据高度非线性,则考虑使用多项式回归、决策树或支持向量机。EDA可以挑选出重要的特征。如果数据量很大,可以使用神经网络。别忘了检查ROC曲线(感受性曲线)、准确率和召回率。
请解释降维,以及使用场合和优势? 解释一下什么是PCA?
降维是一种通过分析出主变量来减少特征变量的过程,其中主变量通常就是重要的特征。一个特征变量的重要性取决于它对数据信息的解释程度,以及你所采用的方法。至于如何选取方法,主要靠不断摸索,以及你自己的偏好。通常大家会从线性方法开始,如果结果欠缺拟合性,则考虑尝试非线性的方法。
数据降维的优势
(1)节省存储空间;
(2)节省计算时间(比如应用于机器学习算法时);
(3)去除冗余特征变量,正如同时以平方米和平方英里存储地区面积没有任何意义(甚至可能是收集数据时出现错误);
(4)将数据降维到二维或三维后,我们或许可以画图,将数据可视化,以观察数据具有的模式,获得对数据的直观感受;
(5)特征变量过多或模型过于复杂可能导致模型过拟合。
PCA(principal Component Analysis),即主成分分析方法,是一种使用最广泛的数据压缩算法。在PCA中,数据从原来的坐标系转换到新的坐标系,由数据本身决定。转换坐标系时,以方差最大的方向作为坐标轴方向,因为数据的最大方差给出了数据的最重要的信息。第一个新坐标轴选择的是原始数据中方差最大的方法,第二个新坐标轴选择的是与第一个新坐标轴正交且方差次大的方向。重复该过程,重复次数为原始数据的特征维数。
通过这种方式获得的新的坐标系,我们发现,大部分方差都包含在前面几个坐标轴中,后面的坐标轴所含的方差几乎为0,。于是,我们可以忽略余下的坐标轴,只保留前面的几个含有绝不部分方差的坐标轴。事实上,这样也就相当于只保留包含绝大部分方差的维度特征,而忽略包含方差几乎为0的特征维度,也就实现了对数据特征的降维处理。
回归(regression)与分类(classification)的区别?
More reading: Regression vs Classification (Math StackExchange)
分类问题是指,给定一个新的模式,根据训练集推断它所对应的类别(如:+1,-1),是一种定性输出,也叫离散变量预测;
回归问题是指,给定一个新的模式,根据训练集推断它所对应的输出值(实数)是多少,是一种定量输出,也叫连续变量预测。
Logistic Regression 和 Linear Regression:
- Linear Regression: 输出一个标量 wx+b,这个值是连续值,所以可以用来处理回归问题。
- Logistic Regression:把上面的 wx+b 通过 sigmoid函数映射到(0,1)上,并划分一个阈值,大于阈值的分为一类,小于等于分为另一类,可以用来处理二分类问题。
- 更进一步:对于N分类问题,则是先得到N组w值不同的 wx+b,然后归一化,比如用 softmax函数,最后变成N个类上的概率,可以处理多分类问题。
Name an example where ensemble techniques might be useful.
More reading: Ensemble learning (Wikipedia)
Ensemble techniques use a combination of learning algorithms to optimize better predictive performance. They typically reduce overfitting in models and make the model more robust (unlikely to be influenced by small changes in the training data).
You could list some examples of ensemble methods, from bagging to boosting to a “bucket of models” method and demonstrate how they could increase predictive power.
如果确定模型是否过拟合overfitting?
More reading: How can I avoid overfitting? (Quora)
overfittingt是这样一种现象:一个假设在训练数据上能够获得比其他假设更好的拟合,但是在训练数据外的数据集上却不能很好的拟合数据。此时我们就叫这个假设出现了overfitting的现象。出现这种现象的主要原因是训练数据中存在噪音或者训练数据太少。
3种方法避免过拟合
1- Keep the model simpler: reduce variance by taking into account fewer variables and parameters, thereby removing some of the noise in the training data.
2- 增加数据量(可以通过交叉验证实现)such as k-folds cross-validation.
3- Use regularization techniques such as LASSO that penalize certain model parameters 在对模型的目标函数(objective function)或代价函数(cost function)加上正则项
Ps: Dropout,应用在深度学习中,例如:CNN。防止模型过拟合,可以提高模型泛化能力。
What evaluation approaches would you work to gauge the effectiveness of a machine learning model?
More reading: How to Evaluate Machine Learning Algorithms (Machine Learning Mastery)
You would first split the dataset into training and test sets, or perhaps use cross-validation techniques to further segment the dataset into composite sets of training and test sets within the data. You should then implement a choice selection of performance metrics: here is a fairly comprehensive list. You could use measures such as the F1 score, the accuracy, and the confusion matrix. What’s important here is to demonstrate that you understand the nuances of how a model is measured and how to choose the right performance measures for the right situations.
如果评估一个逻辑回归模型?
More reading: Evaluating a logistic regression (CrossValidated)
A subsection of the question above. You have to demonstrate an understanding of what the typical goals of a logistic regression are (classification, prediction etc.) and bring up a few examples and use cases.
什么是“核机制”,它有什么优势?
More reading: Kernel method (Wikipedia)
The Kernel trick involves kernel functions that can enable in higher-dimension spaces without explicitly calculating the coordinates of points within that dimension: instead, kernel functions compute the inner products between the images of all pairs of data in a feature space.
This allows them the very useful attribute of calculating the coordinates of higher dimensions while being computationally cheaper than the explicit calculation of said coordinates. Many algorithms can be expressed in terms of inner products. Using the kernel trick enables us effectively run algorithms in a high-dimensional space with lower-dimensional data.
核机制:更高维空间内积的快速计算。也就是说,核机制的本质是计算内积(只不过这里参与内积运算的两点属于更高维的空间)。
如果数据在当前空间中不是线性可分的,则需做transform,将数据变换到更高的维度空间中。
也就是:Kernel = transform + inner product
Kernel机制的必要性和有效性可通过对比传统的高维空间计算内积的方法显现。
传统的方法要分两步,
- step1: 先从X空间升维到Z空间
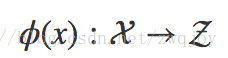
一般情况下,Z空间具有更高的维度。如果升维到无穷维空间,计算量更是难以忍受。
- step2: 再在Z空间里计算内积

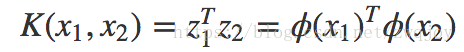
核方法:
也就是说,K(x1,x2)计算得到的结果就是原始数据空间里的两点先升维ϕ(x)再进行内积ϕ(x1)Tϕ(x2)的结果,不必通过显式的升维变换,也即是说,K(⋅)本身内嵌(embedded)了一种升维变换。两步变一步,形式更为简洁。
什么是深度学习,与传统机器学习算法的区别?
More reading: Deep learning (Wikipedia)
(1)传统机器学习算法,在一开始,性能(识别率)会随着数据的增加而增加,但一段时间后,它的性能会进入平台期。这些模型无法处理海量数据。
(2)最近20年来,人类建立了数字王国,使得我们在电脑、网站、手机上的活动,都制造大量数据。便宜的相机、传感器,也产生大量数据。
(3)不同规模的网络,取得的性能也会有不同(具体如下)。
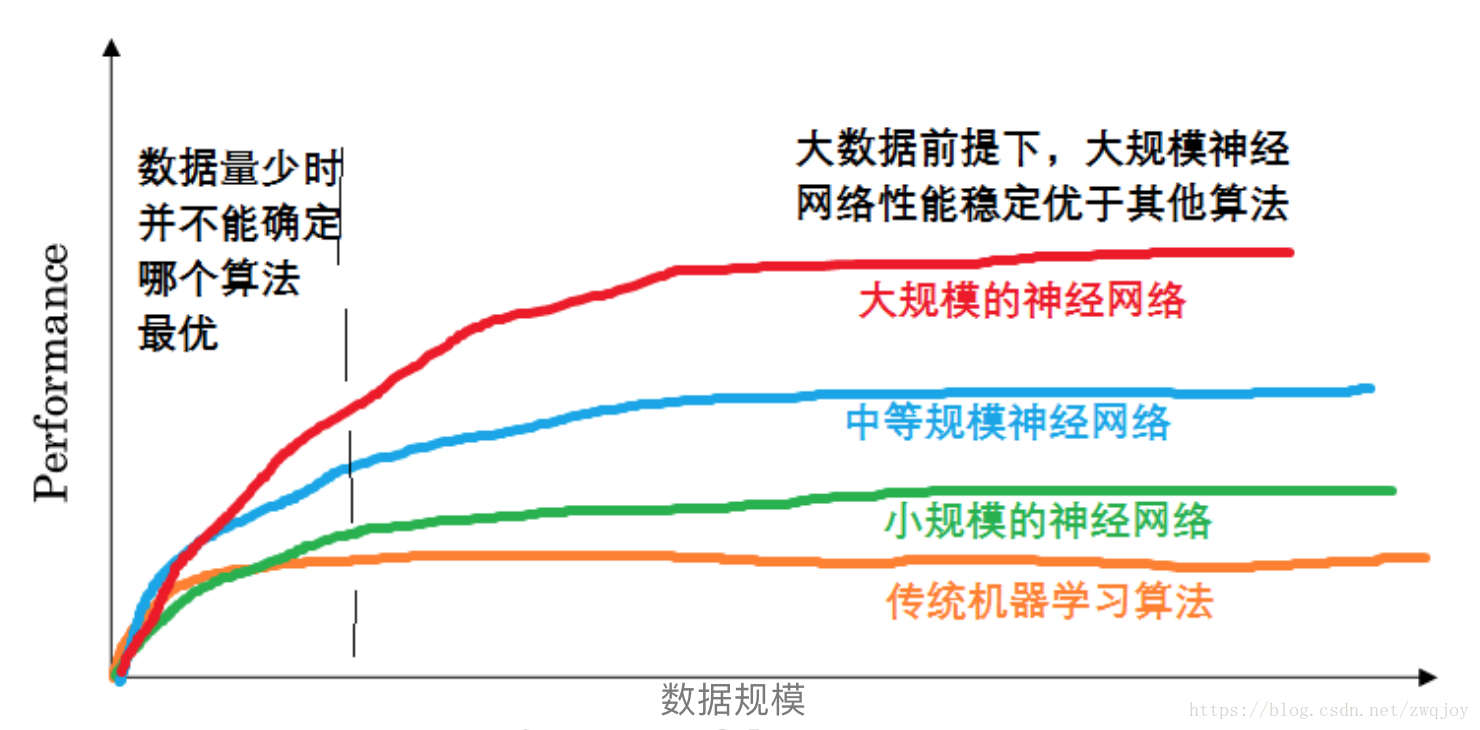
深度学习是一种特殊的机器学习,它将现实世界表示为嵌套的层次概念体系(由较简单概念间的联系定义复杂概念,从一般抽象概括到高级抽象表示),从而获得强大的性能与灵活性。
Deep learning is a subset of machine learning that is concerned with neural networks: how to use backpropagation and certain principles from neuroscience to more accurately model large sets of unlabelled or semi-structured data.
In that sense, deep learning represents an unsupervised learning algorithm that learns representations of data through the use of neural nets.
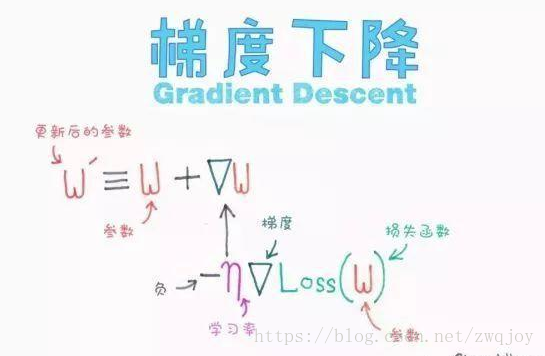
什么是梯度下降?
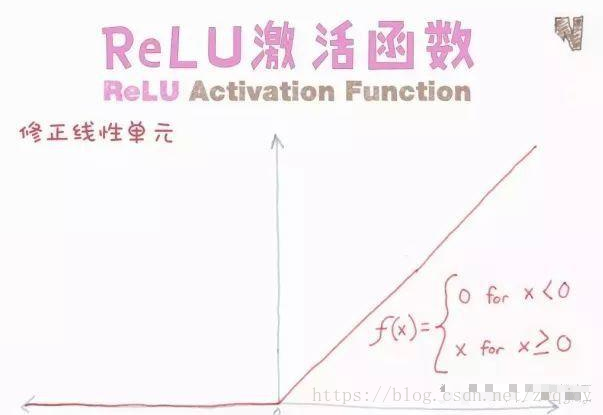
为什么在神经网络中,ReLU是比Sigmoid更好、更常用的激活函数?
批量标准化是什么?它为什么有效?
训练深层神经网络很复杂,因为在训练过程中,随着前几层输入的参数不断变化,每层输入的分布也随之变化。一种方法是将每层输入规范化,输出函数均值为0,标准差为1。对每一层的每个小批量输入都采用上述方式进行规范化(计算每个小批量输入的均值和方差,然后标准化)。这和神经网络的输入的规范化类似。
批量标准化的好处
对输入进行规范化有助于神经网络学习。但神经网络不过是一系列的层,每层的输出又成为下一层的输入。也就是说,我们可以将其中每一层视作子网络的第一层。把神经网络想象成一系列互相传递信息的网络结构,因此在激活函数作用于输出之前,先将每一层输出规范化,再将其传递到下一层(子网络)。
为什么对图像使用卷积而不只是FC层?
这个问题比较有趣,因为提出这个问题的公司并不多。但不排除一些公司会提出这个问题,如果面试时遇见,你可以分为两方面回答这些问题。
卷积可以保存、编码、使用图像的空间信息。只用FC层的话可能就没有相关空间信息了。
卷积神经网络(CNN)某种程度上本身具有平移不变性,因为每个卷积核都充当了它自己的滤波器/特征监测器。
CNN具有平移不变性
上文解释过,每个卷积核都充当了它自己的滤波器/特征监测器。假设你正在进行目标检测,这个目标处于图片的何处并不重要,因为我们要以滑动窗口的方式,将卷积应用于整个图像。
为什么用CNN分类需要进行最大池化?
这也是属于计算机视觉领域的一个问题。CNN中的最大池化可以减少计算量,因为特征图在池化后将会变小。与此同时,因为采取了最大池化,并不会丧失太多图像的语义信息。还有一个理论认为,最大池化有利于使CNN具有更好的平移不变性。关于这个问题,可以看一下吴恩达讲解最大池化优点的视频。
视频链接:https://www.coursera.org/learn/convolutional-neural-networks/lecture/hELHk/pooling-layers
为什么用CNN分割时通常需要编码-解码结构?
CNN编码器可以看作是特征提取网络,解码器则利用它提供的信息,“解码”特征并放大到原始大小,以此预测图像片段
为什么要使用许多小卷积核(如3*3的卷积核),而非少量大卷积核?
这篇VGGNet的论文中有很详细的解释。
使用小卷积核有两个原因:
首先,同少数大卷积核一样,更多小卷积核也可以得到相同的感受野和空间背景,而且用小卷积核需要的参数更少、计算量更小。
其次,使用小卷积核需要更多过滤器,这意味会使用更多的激活函数,因此你的CNN可以得到更具特异性的映射函数。
论文链接:https://arxiv.org/pdf/1409.1556.pdf
What’s your favorite algorithm, and can you explain it to me in less than a minute?
This type of question tests your understanding of how to communicate complex and technical nuances with poise and the ability to summarize quickly and efficiently. Make sure you have a choice and make sure you can explain different algorithms so simply and effectively that a five-year-old could grasp the basics!