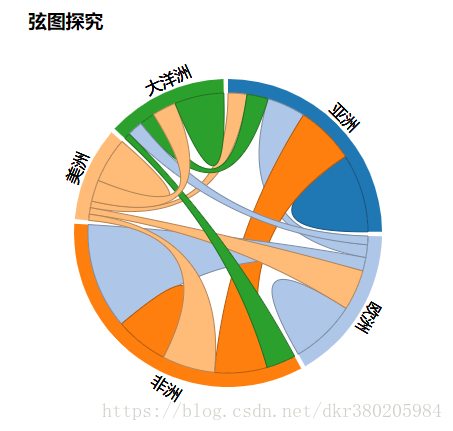
弦图主要用于表现多个节点间的联系,两节点间的连线表示这两个节点有联系,线的粗细代表权重,上图主要表现了各大洲的人口占比(数据纯属虚构)
依旧是V4版本的实现代码和注释(吐槽)
<template>
  <div id='svgContainer' style="">
    <div class="every">
      <h3>弦图探究</h3>
      <div class="svg" id="chordDiagram"></div>
    </div>
  </div>
</template>
<script>
import * as d3 from 'd3'
export default {
  data () {
    return {
    }
  },
  methods: {
    chordDiagram () {
      let width = 400
      let height = 400

      let svg = d3.select('#chordDiagram')
        .append('svg')
        .attr('width', width)
        .attr('height', height)
      // 五大洲人口组成数据
      let continent = ['亚洲', '欧洲', '非洲', '美洲', '大洋洲']
      // 模拟矩阵
      let matrix = [
        [11975, 5871, 8916, 2868, 3241],
        [1951, 10048, 2060, 6171, 1323],
        [8010, 16145, 8090, 8045, 4456],
        [1013, 990, 940, 6907, 3245],
        [2344, 2333, 940, 3654, 7526]
      ]
      let chord = d3.chord()
        .padAngle(0.03)
        .sortSubgroups(d3.ascending)
      // 首先不能这样写 let chord = d3.chord(matrix)..... 这样写根本没返回值
      // 然后chord(matrix)的返回值就是一坨shit
      // (15)[{…}, {…}, {…}, {…}, {…}, {…}, {…}, {…}, {…}, {…}, {…}, {…}, {…}, {…}, {…}, groups: Array(5)]
      // 最后那个group你是怎么想的?直接push进返回值??wtf

      // 获取节点,也就是最后那个group
      let nodes = chord(matrix)['groups']
      // 获取弦,需要剔除最后的那个group
      let arcs = chord(matrix).map((item) => {
        return item
      })
      let color = d3.scaleOrdinal(d3.schemeCategory20)
      // 添加g元素确定弦图的中心
      let gChord = svg.append('g')
        .attr('transform', 'translate(' + width / 2 + ',' + height / 2 + ')')
      // 添加一个装节点的g
      let gOuter = gChord.append('g')
        .attr('class', 'groups')
        .selectAll('g')
        .data(nodes)
        .enter().append('g')
      // 绘制弧
      let innerRadius = width / 2 * 0.7
      let outerRadius = innerRadius * 1.1
      let arc = d3.arc()
        .innerRadius(innerRadius)
        .outerRadius(outerRadius)
      gOuter.append('path')
        .attr('class', 'outerPath')
        .style('fill', function (d) { return color(d.index) })
        // .style('stroke', function (d) { return d3.rgb(color(d.index)).darker() })
        .attr('d', arc)
      // 节点文字绘制
      gOuter.selectAll('.outerText')
        .data(nodes)
        .enter()
        .append('text')
        .each(function (d, i) { // 为绑定的数据添加变量
          d.angle = (d.startAngle + d.endAngle) / 2 // 弧的中心角度
          d.name = continent[i]
        })
        .attr('class', 'outerText')
        .attr('dy', '.35em')
        .attr('transform', function (d) {
          let result = 'rotate(' + (d.angle * 180) / Math.PI + ')' // 旋转
          result += 'translate(-15,' + -1.0 * (outerRadius + 10) + ')' // 平移
          // 对下方文字做旋转180度处理
          if (d.angle > Math.PI * 3 / 4 && d.angle < Math.PI * 5 / 4) {
            result += 'rotate(180)'
          }
          return result
        })
        .text(function (d) {
          return d.name
        })
      // 添加内部的弦
      let ribbon = d3.ribbon()
        .radius(innerRadius)
      gChord.append('g')
        .selectAll('path')
        .data(arcs)
        .enter().append('path')
        .attr('class', 'innerPath')
        .attr('d', ribbon)
        .style('fill', function (d) { return color(d.target.index) })
        .style('stroke', function (d) { return d3.rgb(color(d.target.index)).darker() })
      // 添加鼠标移入动画
      gOuter.selectAll('.outerPath')
        .on('mouseover', function (data) {
          let i = data.index
          svg.selectAll('.innerPath')
            .filter(function (d) {
              return d.source.index !== i && d.target.index !== i
            })
            .transition()
            .duration(500)
            .style('opacity', 0)
        })
        .on('mouseout', function (data) {
          let i = data.index
          svg.selectAll('.innerPath')
            .filter(function (d) {
              return d.source.index !== i && d.target.index !== i
            })
            .transition()
            .duration(500)
            .style('opacity', 1)
        })
    },
  },
  mounted () {
    this.chordDiagram ()
  }
}
</script>
<style lang="less">
#svgContainer{
  width: 100%;
  height: 100%;
  .every{
    width: 400px;
    height: 425px;
    margin:15px;
    float: left;
    h3{
      margin:0;
      .button{
        float: right;
        margin-right: 20px;
        font-size: 14px;
        cursor: pointer;
        padding: 2px 8px;
        border:1px solid #ccc;
        background: yellowgreen;
        border-radius: 4px;
        &:hover{
          background: violet;
        }
      }
    }
    .svg{
      width: 400px;
      height: 400px;
    }
  }
}
</style>