树状图
树状图用于表示层级、上下级、包含与被包含关系。绘制图分为两大部分:
-
元素坐标计算
坐标计算需要一些相关API即可(下面的
新知识部分???),涉及一些节点,连线等。 -
数据绑定
新知识(API)
-
层级布局,需要和tree生成器一起使用,来得到绘制树所需要的节点数据和边数据。
-
后序遍历,官方API的解释如下:
-
d3.tree()
创建一个树状图生成器
-
d3.tree().size()
定义树的大小
-
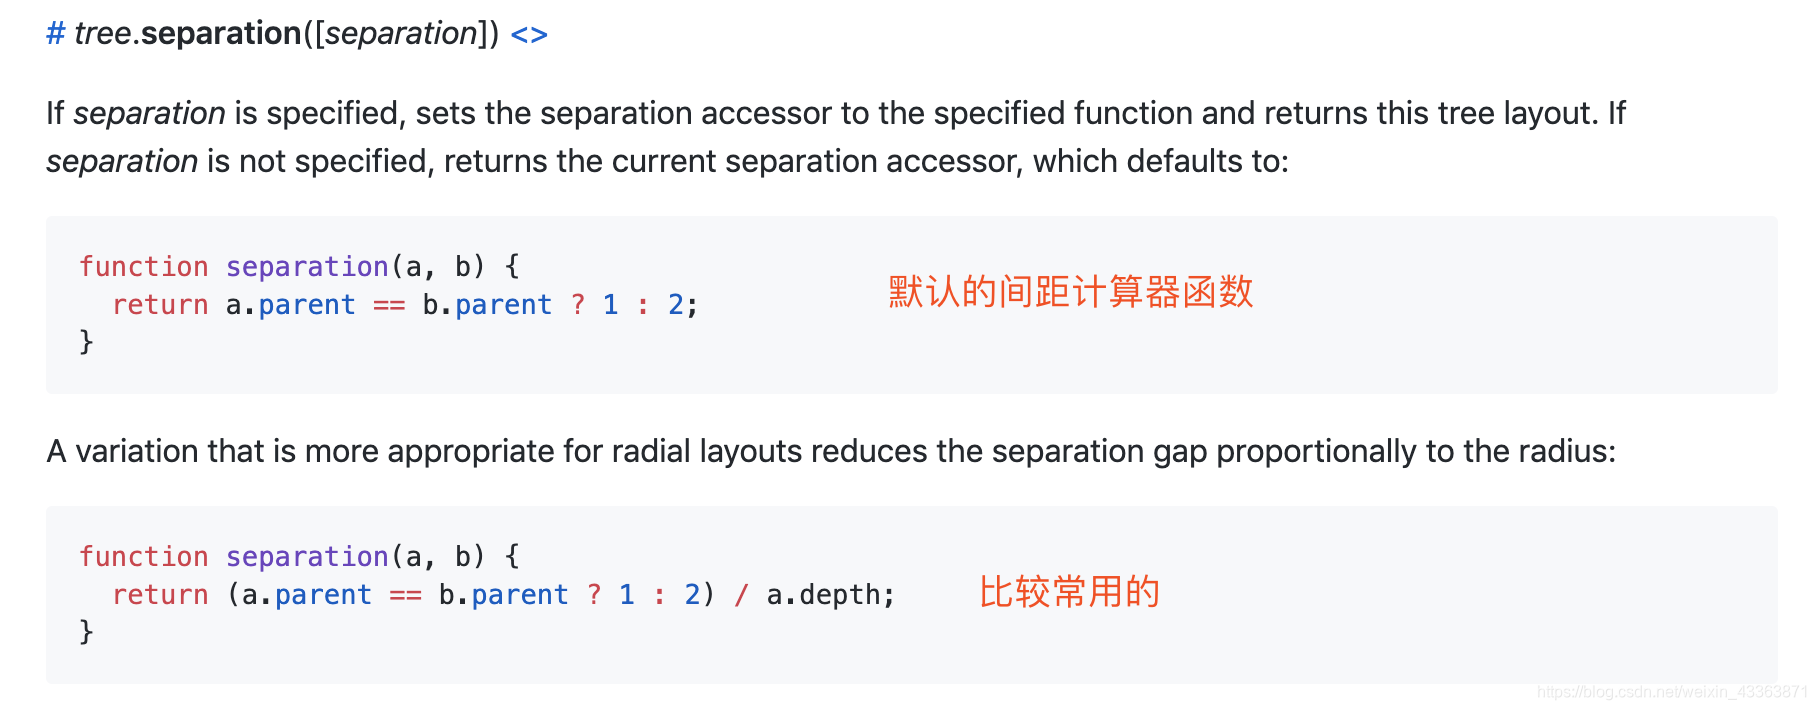
定义邻居节点的距离,这里给出官方API的示例:
-
得到所有的节点,已经经过转换的数据
-
node.links()
得到所有的边,生成一组表示从父节点到子节点关系对象,每个关系对象有两个属性:
source父节点的引用target子节点的引用
-
创建一个水平的贝塞尔生成曲线生成器,(垂直
d3.linkVertical()),这里给出官方API的示例: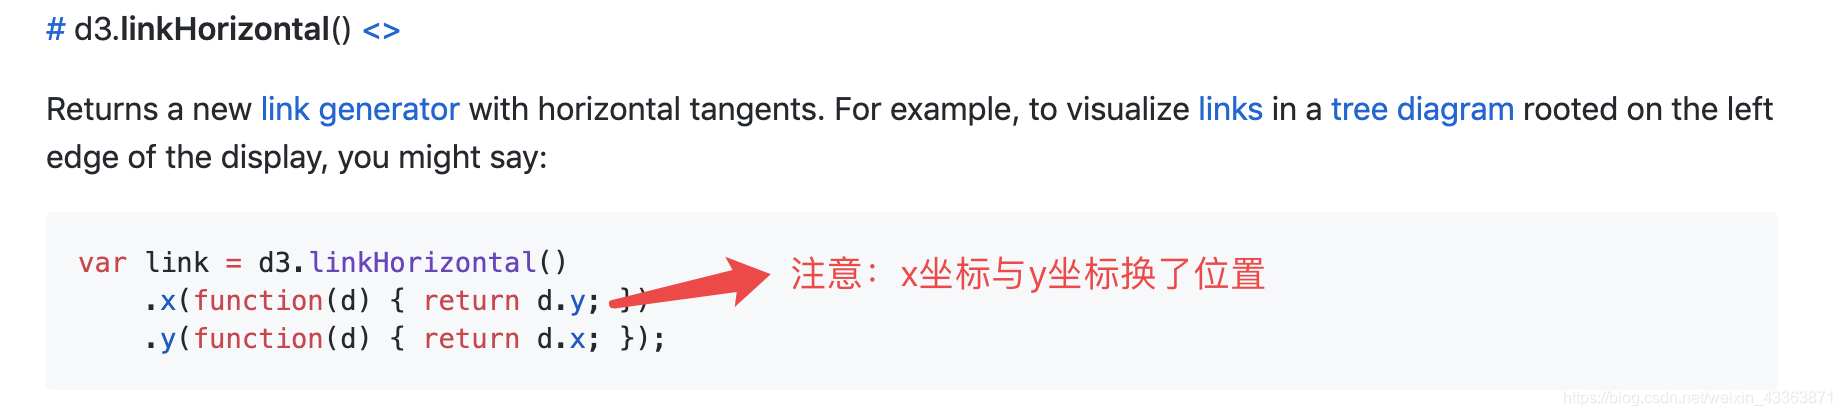
绘制步骤
- 数据
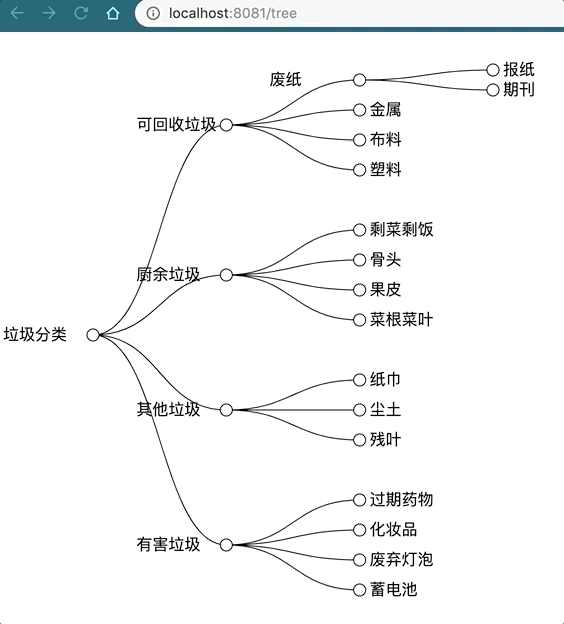
data() { return { //数据 dataset :{ name: "垃圾分类", children: [ { name: "可回收垃圾", children: [ { name: "废纸", children:[ {name:"报纸"}, {name:"期刊"} ] }, { name: "金属" }, { name: "布料" }, { name: "塑料" } ] }, { name: "厨余垃圾", children: [ { name: "剩菜剩饭" }, { name: "骨头" }, { name: "果皮" }, { name: "菜根菜叶" } ] }, { name: "其他垃圾", children: [ { name: "纸巾" }, { name: "尘土" }, { name: "残叶" } ] }, { name: "有害垃圾", children: [ { name: "过期药物" }, { name: "化妆品" }, { name: "废弃灯泡" }, { name: "蓄电池" } ] } ] } }; }, - 定义边界
//定义边界 var margin = { top: 90, bottom: 0, left: 10, right: 0 }; var width=960; var height=600; var svg = d3 .select("body") .append("svg") .attr("width", width + "px") .attr("height", height + "px"); var g = svg .append("g") .attr("transform", "translate(" + margin.top + "," + margin.left + ")"); var scale = svg .append("g") .attr("transform", "translate(" + margin.top + "," + margin.left + ")"); - 创建一个层级布局
// 创建一个层级布局 var hierarchyData = d3.hierarchy(this.dataset).sum(function(d) { return d.value; }); - 创建一个树状图
// 创建一个树状图 var tree = d3 .tree() .size([width - 400, height - 200]) .separation(function(a, b) { return (a.parent == b.parent ? 1 : 2) / a.depth; }); - 初始化树状图,也就是传入数据,并得到绘制树基本数据
var treeData = tree(hierarchyData); - 得到边和节点(已经完成转换的)
var nodes = treeData.descendants(); var links = treeData.links(); - 创建一个贝塞尔生成曲线生成器
var generator = d3 .linkHorizontal() .x(function(d) { return d.y; }) .y(function(d) { return d.x; }); - 绘制边
g.append("g") .selectAll("path") .data(links) .enter() .append("path") .attr("d", function(d) { var start = { x: d.source.x, y: d.source.y }; var end = { x: d.target.x, y: d.target.y }; return generator({ source: start, target: end }); }) .attr("fill", "none") .attr("stroke", "#000") .attr("stroke-width", 1); - 建立用来放在每个节点和对应文字的分组
var gs = g .append("g") .selectAll("g") .data(nodes) .enter() .append("g") .attr("transform", function(d) { var cx = d.x; var cy = d.y; return "translate(" + cy + "," + cx + ")"; }); - 绘制节点和文字
//绘制节点
  gs.append("circle")
    .attr("r", 6)
    .attr("fill", "white")
    .attr("stroke", "#000")
    .attr("stroke-width", 1)
    .on("mouseover", function(d) {   //交互
      d3.select(this)
        .attr("stroke", "skyblue")
        .attr("stroke-width", 2)
    })
    .on("mouseout",function(){
      d3.select(this)
        .attr("stroke", "#000")
        .attr("stroke-width", 1)
    })

  //绘制文字
  gs.append("text")
    .attr("x", function(d) {
      return d.children ? -90 : 10;
    })
    .attr("y", -5)
    .attr("dy", 10)
    .text(function(d) {
      return d.data.name;
    })
    .on("mouseover", function(d) {    //交互
      d3.select(this)
        .attr("fill", "red")
    })
    .on("mouseout",function(){
      d3.select(this)
        .attr("fill", "#000")
    })
效果图