- 下定决心,好好过一天~
这里我的d3是v7版本,框架使用的是vue框架。可以只看methods中写的代码即可
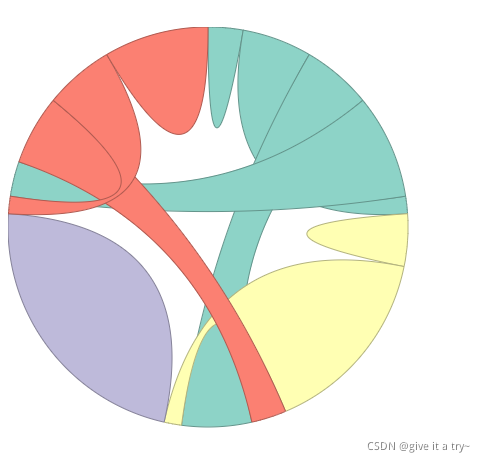
源代码
<template>
  <div id="ChordChartsD3" width=600 height=600></div>
</template>

<script>
import * as d3 from "d3"
export default {


    name:"ChordChartsD3",
    mounted(){


        this.ChordChartsD3();
    },
    methods:{


        ChordChartsD3(){


            var dataAll = [{


                source:{


                    startAngle: 0.2,
                    endAngle: Math.PI * 0.3,
                    // radius: 100
                },
                target:{


                    startAngle: Math.PI*1.0,
                    endAngle: Math.PI*1.6,
                    // radius: 100
                }
            }];

            var matrix = [
                [ 10,  20 , 20 , 30 , 40 ], // 节点1
                [ 5,  15 , 55 , 10  , 10 ], // 节点2
                [ 20,  5 , 80 , 5 , 5  ], // ...
                [ 10,  20 , 20 , 30 , 40 ],
            ]

            var svgWidth = 600,svgHeight = 600;
            var svg = d3.select("#ChordChartsD3")
                        .append("svg")
                        .attr("width",svgWidth)
                        .attr("height",svgHeight);

            var chord = d3.chord()(matrix);
            var ribbon = d3.ribbon().radius(200);
            var colors = d3.schemeSet3;
            function updateCharts(){


                svg.selectAll("path")
                    .data(chord)
                    .enter()
                    .append("path")
                    .attr("d",ribbon)
                    .attr("transform","translate(200,200)")
                    .attr('fill', ({

      source: {

      index } }) => colors[index])
                    .attr('stroke', ({

      source: {

      index } }) => d3.rgb(colors[index]).darker())
                    .on('mouseover', function (d, i) {


                        // console.log(d);
                        // console.log(i);
                        // console.log(i.source.index);
                        d3.select(this)
                            .attr('fill', d3.rgb(colors[i.source.index]).darker())
                    })
                    .on('mouseout', function (d,i) {


                        // console.log(d);
                        // console.log(i);
                        d3.select(this)
                            .attr('fill', colors[i.source.index])
                    });
            }

            updateCharts();
        }
    }
}
</script>

<style>

</style>