移动窗口概念引入
为了提升数据的准确性,将某个点的取值扩大到包含这个点的一段区间,用区间来进行判断,这个区间就是窗口。移动窗口就是窗口向一端滑行,默认是从右往左,每次滑行并不是区间整块的滑行,而是一个单位一个单位的滑行。
举例:
import pandas as pd
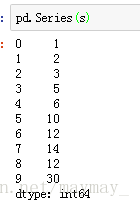
s = [1,2,3,5,6,10,12,14,12,30]
pd.Series(s).rolling(window=3).mean()此时的pd.Series(s)
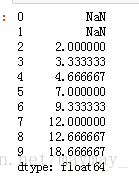
此时的pd.Series(s).rolling(window=3).mean()
如:index2=(index0+index1+index2 )/3
简单的移动窗口函数
- rolling(),参数window指定窗口的大小,参数min_periods指定最小的观察数值个数
- rolling()后,可以接mean、count、sum、median、std等聚合函数,相当于rolling_mean()、rolling_count()、rolling_sum()、rolling_median()、rolling_std()
close_px['AAPL'].plot(figsize=(10,3))
close_px['AAPL'].rolling(window=250).mean().plot()#方法1
close_px['AAPL'].rolling_mean().(window=250).plot()#方法2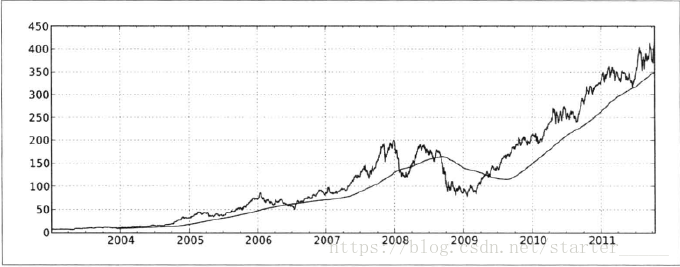
指数加权的移动窗口函数
- ,其中 表示t时刻指数加权的预测值, 表示t时刻的观测值, 是平滑常数。
- 指数加权函数会赋予近期的观测值更大的权数,因此,它能适应更快的变化
- ewm(),若根据跨度指定衰减,即 ,则需要指定参数 ;若根据质心指定衰减,即 ,则需要指定参数 ;若根据半衰期指定衰减,即 ,则需要指定参数 。
- ewm()后,可以接mean、corr、std等聚合函数,相当于ewma()、ewmcorr()、ewmstd(),但count、sum等聚合函数没有对应的特定函数 -
aapl_px = close_px.AAPL['2005':'2009']
aapl_px.ewm(span=60).mean().plot() # 方法1
aapl_px.ewm_mean(span=60).plot() # 方法2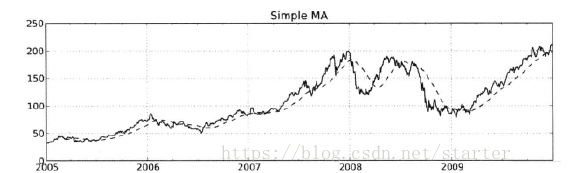
二元移动窗口函数
一些统计计算符,比如相关性和协方差,需要在两个时间序列上进行计算。例如,经济分析通常喜欢比较一只股票与基础指数标普500之间的相关性。我们先计算一下时间序列的百分比变化:
spx_px = close_px_all['SPX']
spx_rets = spx_px.pct_change()  # 相邻两数百分比
returns = close_px.pct_change()
在我们调用rolling后,corr聚合函数会去计算spx_rets的滚动相关性(rolling correlation)
corr = returns.AAPL.rolling(125, min_periods=100).corr(spx_rets)
corr.plot(figsize=(15, 8))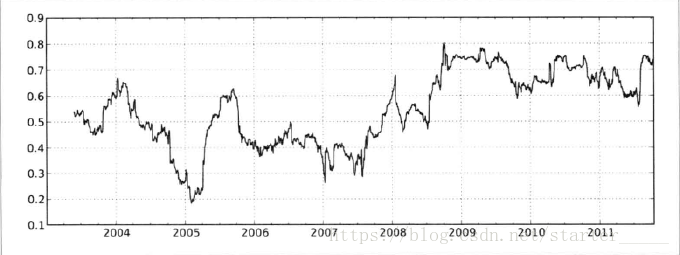
用户自定义的移动窗口函数
- 通过rolling().apply()方法,可以在移动窗口上使用自己定义的函数。唯一需要满足的是,在数组的每一个片段上,函数必须产生单个值。
from scipy.stats import percentileofscore
score_at_2percent = lambda x: percentileofscore(x, 0.02)
result = returns.AAPL.rolling(250).apply(score_at_2percent)
result.plot(figsize=(15, 8))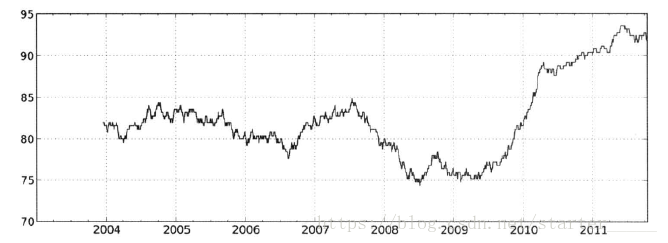
扫描二维码关注公众号,回复:
2772948 查看本文章
