contour 与contourf 是绘制等高线的利器。
contour - 绘制等高线
contourf - 填充等高线
两个的返回值值是一样的(return values are the same),
实际上contourf 相当于 contour filled (英语不好,具体是fill 还是 filled)
常用参数语法
mp.contourf(x, y, z, 等高线条数,cmap=颜色映射)# 等高线填充
mp.contour(x, y, z, 等高线条数,colors=颜色, linewidth=线宽)#等高线绘制
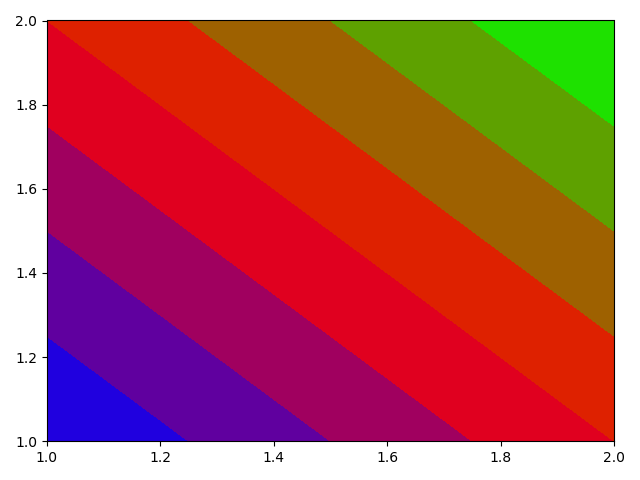
1 示例一
contourf函数是实现等高线的填充功能。
import numpy as np
import matplotlib.pyplot as plt
x=np.array([1,2])
y=np.array([1,2])
z=np.array([[1,2],[2,3]])
plt.xlim(1,2)
plt.ylim(1,2)
plt.contourf(x,y,z,cmap='brg')
help(plt.contour)
plt.show()
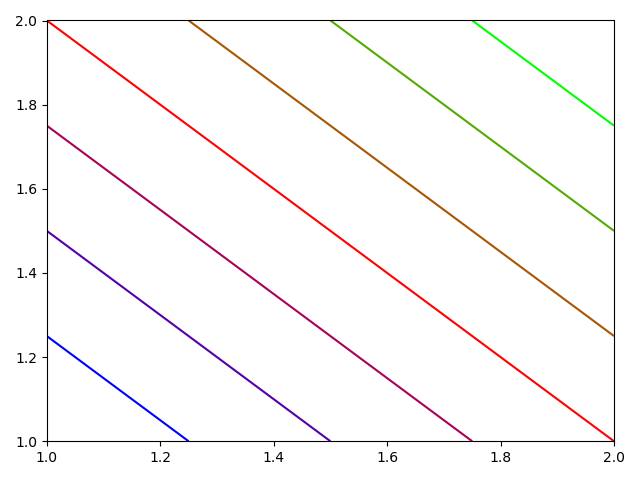
2 示例二
contour实现等高线的绘制功能
import numpy as np
import matplotlib.pyplot as plt
x=np.array([1,2])
y=np.array([1,2])
z=np.array([[1,2],[2,3]])
plt.xlim(1,2)
plt.ylim(1,2)
plt.contour(x,y,z,cmap='brg')
help(plt.contour)
plt.show()
关于怎么计算的,可以参考求问contour 画等高线的原理是什么?
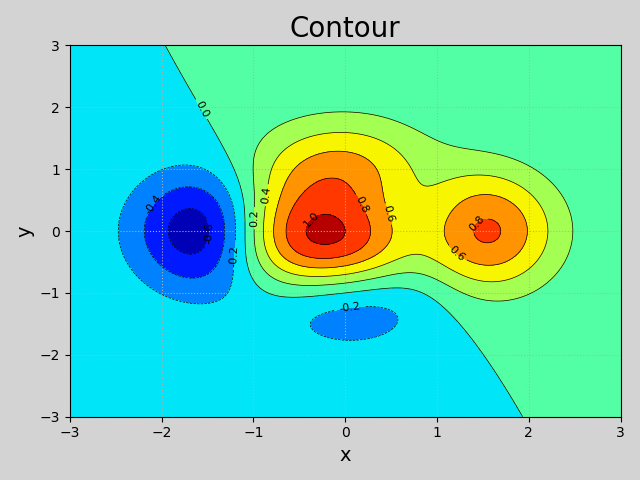
3 示例 3
import numpy as np
import matplotlib.pyplot as plt
n = 1000  # 做1000*1000的点阵

# 用meshgrid生成一个二维数组
x, y = np.meshgrid(np.linspace(-3, 3, n), np.linspace(-3, 3, n))
z = (1 - x / 2 + x**5 + y**3) * np.exp(-x**2 - y**2)

# 画图
plt.figure('Contour', facecolor='lightgray')
plt.title('Contour', fontsize=20)
plt.xlabel('x', fontsize=14)
plt.ylabel('y', fontsize=14)
plt.tick_params(labelsize=10)
plt.grid(linestyle=':')

# 填充等高线图
plt.contourf(x, y, z, 8, cmap='jet')
# 绘制等高线
cntr = plt.contour(x, y, z, 8, colors='black',linewidths=0.5)
# 标注等高线
plt.clabel(cntr, inline_spacing=1, fmt='%.1f', fontsize=8)

plt.show()
注:
(1)绘制等高线 与 填充等高线 不分先后顺序
附 clabel() 函数的用法
释义:
标记等高线,为向 CS 中的轮廓线添加标签,其中CS是一个由contour函数返回的matplotlib.contour.ContourSet对象。
上述示例3中
cntr = plt.contour(x, y, z, 8, colors='black',linewidths=0.5)
print(cntr)
# <matplotlib.contour.QuadContourSet object at 0x00000296B7901CC0>
语法:
clabel(CS, *args, **kwargs)
参数:
CS - 由contour函数产生的句柄对象
fontsize - string(smaller, x-large) or float ,optional
colors - Color of each label
None, 标记的颜色为轮廓的颜色
one string color (e.g color = 'r' ), 所有的标签均为红色
a tuple of matplotlib color args (string, float, rgb, etc), 不同的标签按照指定的颜色标记
inline - bool, optional . 默认True(在标签位值移除轮廓线,也即标签覆盖轮廓线,而非穿越)
inline_spacing - float, optional,默认5,放置内联时,标签两侧留有的像素空间
fmt - string or dict, optional, 默认'%1.3f ',保留小数位。1.3中的1表示输出位宽,3表示小数位长度,此时实际数据会覆盖掉该数据对应的轮廓线;当9.3时,轮廓线会被覆盖掉9个位置,同时小数点后保留3位,也就是说,轮廓线移除的长度大于数据长度 谁能来给我解释一下%2.3d和%3.3f
manual - bool or iterable, optional , 手动添加标签。忽略该字典
rightside_up - bool, optional,默认 True(标签旋转均以正负90度计)
use_clabeltext - bool, optional,默认False,若为True,则用 `ClabelText` class (instead of `Text`) 创建标签,当使用“CababelTress”绘制文本时,会重新计算文本的旋转角度,因此,如果轴的角度发生变化时,可以使用“CababelTress”来旋转角度。