\documentclass{article}

\title{tutorials}
\author{winycg}
\date{\today}

\usepackage[a5paper, left=10mm, right=10mm,
top=15mm, bottom=15mm]{geometry}  % 设置纸张大小和页边距
\usepackage{indentfirst}  % 使用后每个section的首段首行自动缩进
\usepackage{booktabs}

\begin{document}

\maketitle  % 将标题,作者,日期信息显示出来

\tableofcontents  % 在此位置根据标题自动生成目录

\begin{abstract}
	This is the abstract.
\end{abstract}

\section{what is conv}  % 一个章节

In the convolution neural network, each layer of coiling layer (Convolutional layer) is composed of several convolution units. The parameters of each convolution  \par  % 分段
The first layer convolution layer may only extract some low-level features such as edges, lines and corners.

The first conv\footnote{The first layer convolution layer may only extract some low-level features} is:  % \footnote在页脚产生注释

\begin{table}[htbp]
\centering
\caption{data}
	\begin{tabular}{lccr}  % lccr表示表格的4列分别为左对齐,居中,居中,右对齐
	\hline  % 画一条横线
	1&2&3&4 \\  % 表格中的内容,用&分开
	\hline
	0.1&0.2&0.3&0.4 \\
	\hline
	\end{tabular}
\end{table}

% 制作三线表
\begin{table}[htbp]
	\centering
	\caption{three-line table}
	\begin{tabular}{cccc}
		\toprule
		1&2&3&4 \\  % 表格中的内容,用&分开
		\midrule
		0.1&0.2&0.3&0.4 \\
		\bottomrule
	\end{tabular}
\end{table}

% 插入行间公式
\begin{equation}
	y = \sin{(x)}
\end{equation}

\newpage  % 产生新的一页

% 特殊符号以及字体
The font is \textit{italic}.

The font is \textbf{boldface}.

The mathematic expressions, like for all $\alpha \in R$ or $a+b=0$.

The special symbols, like \#,\$,\{ \}.
\end{document}A

图片插入
插入图片
LaTex支持插入矢量的pdf和eps图片,将图片直接拖入TexStudio可以直接生成插入图片的代码并实现宽度缩放为页面宽度的0.7,高度按比例自动缩放。使用宏包\usepackage{graphicx}
htbp为figure的可选参数:
- h:here,当前位置. 将图形放置在 正文文本中给出该图形环境的地方.如果本页所剩的页面不够, 这一参数将不起作用.
- t:top,顶部. 将图形放置在页面的顶部.
- b:bottom,底部. 将图形放置在页面的底部.
- p,page,浮动页. 将图形放置在一只允许有浮动对象的页面上.
说明:
(1)如果在图形环境中没有给出上述任一参数,则缺省为 [tbp]
(2)给出参数的顺序不会影响到最后的结果。因为在考虑这些参数时 LATEX 总是尝试以 h-t-b-p 的顺序来确定图形的位置。
(3)只给出单个的参数项极易引发问题. 如果该图形不适合所指定的位置,它就会被搁置并阻碍对后面的图形 的处理.一旦这些阻塞的图形数目超过了18 幅这一 LaTex所能容许的最大值,就会产生 “Too Many Unprocessed Floats”的错误。所以一般使用参数[htbp]
\begin{figure}[htbp]
	\centering  % 设置对齐格式
	% 宽度缩放为页面宽度的0.7,高度按比例自动缩放
	% 也可以用width=, height=来指定大小
	\includegraphics[width=0.7\linewidth]{Figure_1.pdf}
	\caption{The relationship}  % 图的标题
	\label{fig:figure1}
\end{figure}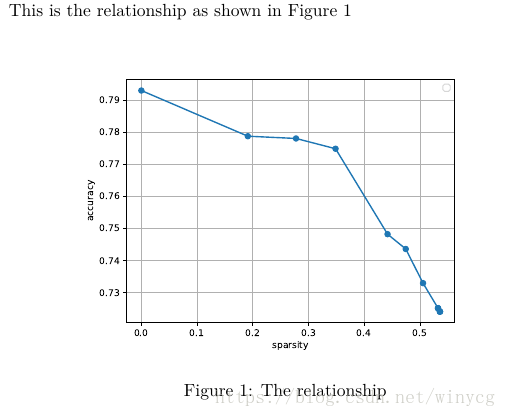
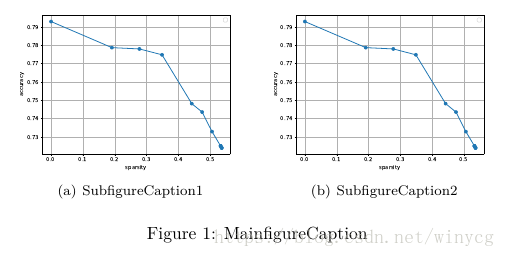
插入并列的子图,使用宏包\usepackage{subfigure}
\begin{figure}[htbp]
	\centering
	\subfigure[SubfigureCaption1]{   % 参数为子图标题
		\label{Fig.sub.1}
		\includegraphics[width=0.4\textwidth]{Figure_1.pdf}}
	\subfigure[SubfigureCaption2]{
		\label{Fig.sub.2}
		\includegraphics[width=0.4\textwidth]{Figure_1.pdf}}
	\caption{MainfigureCaption}
	\label{Fig.lable}
\end{figure}