Prometheus简介(基于Kubernetes)
本文中不包含Alertmanager和远程存储的内容,下次有时间在补充!!!
1、Prometheus简介
Prometheus是一个开源的系统监控工具。根据配置的任务(job)以http/s周期性的收刮(scrape/pull)指定目标(target)上的指标(metric)。目标(target)可以以静态方式或者自动发现方式指定。Prometheus将收刮(scrape)的指标(metric)保存在本地或者远程存储上。
Prometheus以pull方式来收集指标。对比push方式,pull可以集中配置、针对不同的视角搭建不同的监控系统;
Prometheus于2016年加入CNCF,是继kubernetes之后,第二个加入CNCF的开源项目!
1.1、体系结构

- Prometheus Server:核心组件,负责收刮和存储时序数据(time series data),并且提供查询接口;
Jobs/Exporters:客户端,监控并采集指标,对外暴露HTTP服务(/metrics);目前已经有很多的软件原生就支持Prometjeus,提供/metrics,可以直接使用;对于像操作系统已经不提供/metrics的应用,可以使用现有的exporters或者开发自己的exporters来提供/metrics服务;
Pushgateway:针对push系统设计,Short-lived jobs定时将指标push到Pushgateway,再由Prometheus Server从Pushgateway上pull;
- Alertmanager:报警组件,根据实现配置的规则(rule)进行响应,例如发送邮件;
- Web UI:Prometheus内置一个简单的Web控制台,可以查询指标,查看配置信息或者Service Discovery等,实际工作中,查看指标或者创建仪表盘通常使用Grafana,Prometheus作为Grafana的数据源;
1.2、数据结构
Prometheus按照时间序列存储指标,每一个指标都由Notation + Samples组成:
- Notation:通常有指标名称与一组label组成:
<metric name>{<label name>=<label value>, ...}- Samples:样品,通常包含一个64位的浮点值和一个毫秒级的时间戳
2、安装部署
2.1、环境清单
- 系统环境
root@master:~# uname -a
Linux master 4.4.0-62-generic #83-Ubuntu SMP Wed Jan 18 14:10:15 UTC 2017 x86_64 x86_64 x86_64 GNU/Linux

root@master:~# kubectl get nodes -o wide
NAME      STATUS    ROLES     AGE       VERSION           EXTERNAL-IP   OS-IMAGE             KERNEL-VERSION     CONTAINER-RUNTIME
master    Ready     master    11d       v1.9.0+coreos.0   <none>        Ubuntu 16.04.2 LTS   4.4.0-62-generic   docker://17.12.0-ce
node1     Ready     <none>    11d       v1.9.0+coreos.0   <none>        Ubuntu 16.04.2 LTS   4.4.0-62-generic   docker://17.12.0-ce
node2     Ready     <none>    11d       v1.9.0+coreos.0   <none>        Ubuntu 16.04.2 LTS   4.4.0-62-generic   docker://17.12.0-ce
node3     Ready     <none>    11d       v1.9.0+coreos.0   <none>        Ubuntu 16.04.2 LTS   4.4.0-62-generic   docker://17.12.0-ce

root@master:~# kubectl get pods --all-namespaces -o wide
NAMESPACE     NAME                                    READY     STATUS    RESTARTS   AGE       IP                NODE
kube-system   calico-node-64btj                       1/1       Running   0          11d       192.168.115.213   node3
kube-system   calico-node-8wqtc                       1/1       Running   0          11d       192.168.115.211   node1
kube-system   calico-node-hrmql                       1/1       Running   0          11d       192.168.115.210   master
kube-system   calico-node-wvgtc                       1/1       Running   0          11d       192.168.115.212   node2
kube-system   kube-apiserver-master                   1/1       Running   0          11d       192.168.115.210   master
kube-system   kube-controller-manager-master          1/1       Running   0          11d       192.168.115.210   master
kube-system   kube-dns-7d9c4d7876-wxss9               3/3       Running   0          11d       10.233.75.2       node2
kube-system   kube-dns-7d9c4d7876-xbxbg               3/3       Running   0          11d       10.233.102.129    node1
kube-system   kube-proxy-gprzq                        1/1       Running   0          11d       192.168.115.211   node1
kube-system   kube-proxy-k9gpk                        1/1       Running   0          11d       192.168.115.213   node3
kube-system   kube-proxy-kwl5c                        1/1       Running   0          11d       192.168.115.212   node2
kube-system   kube-proxy-plxpc                        1/1       Running   0          11d       192.168.115.210   master
kube-system   kube-scheduler-master                   1/1       Running   0          11d       192.168.115.210   master
kube-system   kube-state-metrics-868cf44b5f-g8qfj     2/2       Running   0          6d        10.233.102.157    node1
kube-system   kubedns-autoscaler-564b455d77-7rm9g     1/1       Running   0          11d       10.233.75.1       node2
kube-system   kubernetes-dashboard-767994d8b8-wmzs7   1/1       Running   0          11d       10.233.75.3       node2
kube-system   nginx-proxy-node1                       1/1       Running   0          11d       192.168.115.211   node1
kube-system   nginx-proxy-node2                       1/1       Running   0          11d       192.168.115.212   node2
kube-system   nginx-proxy-node3                       1/1       Running   0          11d       192.168.115.213   node3
kube-system   tiller-deploy-f9b69765d-lvw8k           1/1       Running   0          11d       10.233.71.5       node3

root@master:~# showmount -e
Export list for master:
/nfs *- 创建namespace
root@master:~/kubernetes/prometheus# cat namespace.yml
---
apiVersion: v1
kind: Namespace
metadata:
  name: ns-monitor
  labels:
    name: ns-monitor

root@master:~/kubernetes/prometheus# kubectl apply -f namespace.yml
2.2、部署node-exporter
- node-exporter.yml文件内容
---
kind: DaemonSet
apiVersion: apps/v1beta2
metadata:
  labels:
    app: node-exporter
  name: node-exporter
  namespace: ns-monitor
spec:
  revisionHistoryLimit: 10
  selector:
    matchLabels:
      app: node-exporter
  template:
    metadata:
      labels:
        app: node-exporter
    spec:
      containers:
        - name: node-exporter
          image: 192.168.101.88:5000/prom/node-exporter:v0.15.2
          ports:
            - containerPort: 9100
              protocol: TCP
      hostNetwork: true
      hostPID: true
      tolerations:
        - effect: NoSchedule
          operator: Exists
---
kind: Service
apiVersion: v1
metadata:
  labels:
    app: node-exporter
  name: node-exporter-service
  namespace: ns-monitor
spec:
  ports:
    - port: 9100
      targetPort: 9100
  selector:
    app: node-exporter
clusterIP: None- 部署node-exporter
root@master:~/kubernetes/prometheus# kubectl apply -f node-exporter.yml

root@master:~/kubernetes/prometheus# kubectl get pods -n ns-monitor -o wide
NAME                          READY     STATUS    RESTARTS   AGE       IP                NODE
node-exporter-br7wz           1/1       Running   0          3h        192.168.115.210   master
node-exporter-jzc6f           1/1       Running   0          3h        192.168.115.212   node2
node-exporter-t9s2f           1/1       Running   0          3h        192.168.115.213   node3
node-exporter-trh52           1/1       Running   0          3h        192.168.115.211   node1
Node-exporter用于采集kubernetes集群中各个节点的物理指标,比如:Memory、CPU等。可以直接在每个物理节点是直接安装,这里我们使用DaemonSet部署到每个节点上,使用
hostNetwork: true和hostPID: true使其获得Node的物理指标信息;配置tolerations使其在master节点也启动一个pod,我的集群默认情况下,master不参与负载;
- 查看node-exporter指标信息
使用浏览器访问任意节点的9100端口
2.3、部署Prometheus
- prometheus.yml文件内容
---
apiVersion: rbac.authorization.k8s.io/v1beta1
kind: ClusterRole
metadata:
  name: prometheus
rules:
  - apiGroups: [""] # "" indicates the core API group
    resources:
      - nodes
      - nodes/proxy
      - services
      - endpoints
      - pods
    verbs:
      - get
      - watch
      - list
  - apiGroups:
      - extensions
    resources:
      - ingresses
    verbs:
      - get
      - watch
      - list
  - nonResourceURLs: ["/metrics"]
    verbs:
      - get
---
apiVersion: v1
kind: ServiceAccount
metadata:
  name: prometheus
  namespace: ns-monitor
  labels:
    app: prometheus
---
apiVersion: rbac.authorization.k8s.io/v1beta1
kind: ClusterRoleBinding
metadata:
  name: prometheus
subjects:
  - kind: ServiceAccount
    name: prometheus
    namespace: ns-monitor
roleRef:
  kind: ClusterRole
  name: prometheus
  apiGroup: rbac.authorization.k8s.io
---
apiVersion: v1
kind: ConfigMap
metadata:
  name: prometheus-conf
  namespace: ns-monitor
  labels:
    app: prometheus
data:
  prometheus.yml: |-
    # my global config
    global:
      scrape_interval:     15s # Set the scrape interval to every 15 seconds. Default is every 1 minute.
      evaluation_interval: 15s # Evaluate rules every 15 seconds. The default is every 1 minute.
      # scrape_timeout is set to the global default (10s).

    # Alertmanager configuration
    alerting:
      alertmanagers:
      - static_configs:
        - targets:
          # - alertmanager:9093

    # Load rules once and periodically evaluate them according to the global 'evaluation_interval'.
    rule_files:
      # - "first_rules.yml"
      # - "second_rules.yml"

    # A scrape configuration containing exactly one endpoint to scrape:
    # Here it's Prometheus itself.
    scrape_configs:
      # The job name is added as a label `job=<job_name>` to any timeseries scraped from this config.
      - job_name: 'prometheus'

        # metrics_path defaults to '/metrics'
        # scheme defaults to 'http'.

        static_configs:
          - targets: ['localhost:9090']
      - job_name: 'grafana'
        static_configs:
          - targets:
              - 'grafana-service.ns-monitor:3000'

      - job_name: 'kubernetes-apiservers'

        kubernetes_sd_configs:
        - role: endpoints

        # Default to scraping over https. If required, just disable this or change to
        # `http`.
        scheme: https

        # This TLS & bearer token file config is used to connect to the actual scrape
        # endpoints for cluster components. This is separate to discovery auth
        # configuration because discovery & scraping are two separate concerns in
        # Prometheus. The discovery auth config is automatic if Prometheus runs inside
        # the cluster. Otherwise, more config options have to be provided within the
        # <kubernetes_sd_config>.
        tls_config:
          ca_file: /var/run/secrets/kubernetes.io/serviceaccount/ca.crt
          # If your node certificates are self-signed or use a different CA to the
          # master CA, then disable certificate verification below. Note that
          # certificate verification is an integral part of a secure infrastructure
          # so this should only be disabled in a controlled environment. You can
          # disable certificate verification by uncommenting the line below.
          #
          # insecure_skip_verify: true
        bearer_token_file: /var/run/secrets/kubernetes.io/serviceaccount/token

        # Keep only the default/kubernetes service endpoints for the https port. This
        # will add targets for each API server which Kubernetes adds an endpoint to
        # the default/kubernetes service.
        relabel_configs:
        - source_labels: [__meta_kubernetes_namespace, __meta_kubernetes_service_name, __meta_kubernetes_endpoint_port_name]
          action: keep
          regex: default;kubernetes;https

      # Scrape config for nodes (kubelet).
      #
      # Rather than connecting directly to the node, the scrape is proxied though the
      # Kubernetes apiserver.  This means it will work if Prometheus is running out of
      # cluster, or can't connect to nodes for some other reason (e.g. because of
      # firewalling).
      - job_name: 'kubernetes-nodes'

        # Default to scraping over https. If required, just disable this or change to
        # `http`.
        scheme: https

        # This TLS & bearer token file config is used to connect to the actual scrape
        # endpoints for cluster components. This is separate to discovery auth
        # configuration because discovery & scraping are two separate concerns in
        # Prometheus. The discovery auth config is automatic if Prometheus runs inside
        # the cluster. Otherwise, more config options have to be provided within the
        # <kubernetes_sd_config>.
        tls_config:
          ca_file: /var/run/secrets/kubernetes.io/serviceaccount/ca.crt
        bearer_token_file: /var/run/secrets/kubernetes.io/serviceaccount/token

        kubernetes_sd_configs:
        - role: node

        relabel_configs:
        - action: labelmap
          regex: __meta_kubernetes_node_label_(.+)
        - target_label: __address__
          replacement: kubernetes.default.svc:443
        - source_labels: [__meta_kubernetes_node_name]
          regex: (.+)
          target_label: __metrics_path__
          replacement: /api/v1/nodes/${1}/proxy/metrics

      # Scrape config for Kubelet cAdvisor.
      #
      # This is required for Kubernetes 1.7.3 and later, where cAdvisor metrics
      # (those whose names begin with 'container_') have been removed from the
      # Kubelet metrics endpoint.  This job scrapes the cAdvisor endpoint to
      # retrieve those metrics.
      #
      # In Kubernetes 1.7.0-1.7.2, these metrics are only exposed on the cAdvisor
      # HTTP endpoint; use "replacement: /api/v1/nodes/${1}:4194/proxy/metrics"
      # in that case (and ensure cAdvisor's HTTP server hasn't been disabled with
      # the --cadvisor-port=0 Kubelet flag).
      #
      # This job is not necessary and should be removed in Kubernetes 1.6 and
      # earlier versions, or it will cause the metrics to be scraped twice.
      - job_name: 'kubernetes-cadvisor'

        # Default to scraping over https. If required, just disable this or change to
        # `http`.
        scheme: https

        # This TLS & bearer token file config is used to connect to the actual scrape
        # endpoints for cluster components. This is separate to discovery auth
        # configuration because discovery & scraping are two separate concerns in
        # Prometheus. The discovery auth config is automatic if Prometheus runs inside
        # the cluster. Otherwise, more config options have to be provided within the
        # <kubernetes_sd_config>.
        tls_config:
          ca_file: /var/run/secrets/kubernetes.io/serviceaccount/ca.crt
        bearer_token_file: /var/run/secrets/kubernetes.io/serviceaccount/token

        kubernetes_sd_configs:
        - role: node

        relabel_configs:
        - action: labelmap
          regex: __meta_kubernetes_node_label_(.+)
        - target_label: __address__
          replacement: kubernetes.default.svc:443
        - source_labels: [__meta_kubernetes_node_name]
          regex: (.+)
          target_label: __metrics_path__
          replacement: /api/v1/nodes/${1}/proxy/metrics/cadvisor

      # Scrape config for service endpoints.
      #
      # The relabeling allows the actual service scrape endpoint to be configured
      # via the following annotations:
      #
      # * `prometheus.io/scrape`: Only scrape services that have a value of `true`
      # * `prometheus.io/scheme`: If the metrics endpoint is secured then you will need
      # to set this to `https` & most likely set the `tls_config` of the scrape config.
      # * `prometheus.io/path`: If the metrics path is not `/metrics` override this.
      # * `prometheus.io/port`: If the metrics are exposed on a different port to the
      # service then set this appropriately.
      - job_name: 'kubernetes-service-endpoints'

        kubernetes_sd_configs:
        - role: endpoints

        relabel_configs:
        - source_labels: [__meta_kubernetes_service_annotation_prometheus_io_scrape]
          action: keep
          regex: true
        - source_labels: [__meta_kubernetes_service_annotation_prometheus_io_scheme]
          action: replace
          target_label: __scheme__
          regex: (https?)
        - source_labels: [__meta_kubernetes_service_annotation_prometheus_io_path]
          action: replace
          target_label: __metrics_path__
          regex: (.+)
        - source_labels: [__address__, __meta_kubernetes_service_annotation_prometheus_io_port]
          action: replace
          target_label: __address__
          regex: ([^:]+)(?::\d+)?;(\d+)
          replacement: $1:$2
        - action: labelmap
          regex: __meta_kubernetes_service_label_(.+)
        - source_labels: [__meta_kubernetes_namespace]
          action: replace
          target_label: kubernetes_namespace
        - source_labels: [__meta_kubernetes_service_name]
          action: replace
          target_label: kubernetes_name

      # Example scrape config for probing services via the Blackbox Exporter.
      #
      # The relabeling allows the actual service scrape endpoint to be configured
      # via the following annotations:
      #
      # * `prometheus.io/probe`: Only probe services that have a value of `true`
      - job_name: 'kubernetes-services'

        metrics_path: /probe
        params:
          module: [http_2xx]

        kubernetes_sd_configs:
        - role: service

        relabel_configs:
        - source_labels: [__meta_kubernetes_service_annotation_prometheus_io_probe]
          action: keep
          regex: true
        - source_labels: [__address__]
          target_label: __param_target
        - target_label: __address__
          replacement: blackbox-exporter.example.com:9115
        - source_labels: [__param_target]
          target_label: instance
        - action: labelmap
          regex: __meta_kubernetes_service_label_(.+)
        - source_labels: [__meta_kubernetes_namespace]
          target_label: kubernetes_namespace
        - source_labels: [__meta_kubernetes_service_name]
          target_label: kubernetes_name

      # Example scrape config for probing ingresses via the Blackbox Exporter.
      #
      # The relabeling allows the actual ingress scrape endpoint to be configured
      # via the following annotations:
      #
      # * `prometheus.io/probe`: Only probe services that have a value of `true`
      - job_name: 'kubernetes-ingresses'

        metrics_path: /probe
        params:
          module: [http_2xx]

        kubernetes_sd_configs:
          - role: ingress

        relabel_configs:
          - source_labels: [__meta_kubernetes_ingress_annotation_prometheus_io_probe]
            action: keep
            regex: true
          - source_labels: [__meta_kubernetes_ingress_scheme,__address__,__meta_kubernetes_ingress_path]
            regex: (.+);(.+);(.+)
            replacement: ${1}://${2}${3}
            target_label: __param_target
          - target_label: __address__
            replacement: blackbox-exporter.example.com:9115
          - source_labels: [__param_target]
            target_label: instance
          - action: labelmap
            regex: __meta_kubernetes_ingress_label_(.+)
          - source_labels: [__meta_kubernetes_namespace]
            target_label: kubernetes_namespace
          - source_labels: [__meta_kubernetes_ingress_name]
            target_label: kubernetes_name

      # Example scrape config for pods
      #
      # The relabeling allows the actual pod scrape endpoint to be configured via the
      # following annotations:
      #
      # * `prometheus.io/scrape`: Only scrape pods that have a value of `true`
      # * `prometheus.io/path`: If the metrics path is not `/metrics` override this.
      # * `prometheus.io/port`: Scrape the pod on the indicated port instead of the
      # pod's declared ports (default is a port-free target if none are declared).
      - job_name: 'kubernetes-pods'

        kubernetes_sd_configs:
        - role: pod

        relabel_configs:
        - source_labels: [__meta_kubernetes_pod_annotation_prometheus_io_scrape]
          action: keep
          regex: true
        - source_labels: [__meta_kubernetes_pod_annotation_prometheus_io_path]
          action: replace
          target_label: __metrics_path__
          regex: (.+)
        - source_labels: [__address__, __meta_kubernetes_pod_annotation_prometheus_io_port]
          action: replace
          regex: ([^:]+)(?::\d+)?;(\d+)
          replacement: $1:$2
          target_label: __address__
        - action: labelmap
          regex: __meta_kubernetes_pod_label_(.+)
        - source_labels: [__meta_kubernetes_namespace]
          action: replace
          target_label: kubernetes_namespace
        - source_labels: [__meta_kubernetes_pod_name]
          action: replace
          target_label: kubernetes_pod_name
---
apiVersion: v1
kind: ConfigMap
metadata:
  name: prometheus-rules
  namespace: ns-monitor
  labels:
    app: prometheus
data:
  cpu-usage.rule: |
    groups:
      - name: NodeCPUUsage
        rules:
          - alert: NodeCPUUsage
            expr: (100 - (avg by (instance) (irate(node_cpu{name="node-exporter",mode="idle"}[5m])) * 100)) > 75
            for: 2m
            labels:
              severity: "page"
            annotations:
              summary: "{{$labels.instance}}: High CPU usage detected"
              description: "{{$labels.instance}}: CPU usage is above 75% (current value is: {{ $value }})"
---
apiVersion: v1
kind: PersistentVolume
metadata:
  name: "prometheus-data-pv"
  labels:
    name: prometheus-data-pv
    release: stable
spec:
  capacity:
    storage: 5Gi
  accessModes:
    - ReadWriteOnce
  persistentVolumeReclaimPolicy: Recycle
  nfs:
    path: /nfs/prometheus/data
    server: 192.168.115.210

---
apiVersion: v1
kind: PersistentVolumeClaim
metadata:
  name: prometheus-data-pvc
  namespace: ns-monitor
spec:
  accessModes:
    - ReadWriteOnce
  resources:
    requests:
      storage: 5Gi
  selector:
    matchLabels:
      name: prometheus-data-pv
      release: stable

---
kind: Deployment
apiVersion: apps/v1beta2
metadata:
  labels:
    app: prometheus
  name: prometheus
  namespace: ns-monitor
spec:
  replicas: 1
  revisionHistoryLimit: 10
  selector:
    matchLabels:
      app: prometheus
  template:
    metadata:
      labels:
        app: prometheus
    spec:
      serviceAccountName: prometheus
      securityContext:
        runAsUser: 65534
        fsGroup: 65534
      containers:
        - name: prometheus
          image: 192.168.101.88:5000/prom/prometheus:v2.2.1
          volumeMounts:
            - mountPath: /prometheus
              name: prometheus-data-volume
            - mountPath: /etc/prometheus/prometheus.yml
              name: prometheus-conf-volume
              subPath: prometheus.yml
            - mountPath: /etc/prometheus/rules
              name: prometheus-rules-volume
          ports:
            - containerPort: 9090
              protocol: TCP
      volumes:
        - name: prometheus-data-volume
          persistentVolumeClaim:
            claimName: prometheus-data-pvc
        - name: prometheus-conf-volume
          configMap:
            name: prometheus-conf
        - name: prometheus-rules-volume
          configMap:
            name: prometheus-rules
      tolerations:
        - key: node-role.kubernetes.io/master
          effect: NoSchedule

---
kind: Service
apiVersion: v1
metadata:
  annotations:
    prometheus.io/scrape: 'true'
  labels:
    app: prometheus
  name: prometheus-service
  namespace: ns-monitor
spec:
  ports:
    - port: 9090
      targetPort: 9090
  selector:
    app: prometheus
  type: NodePort
说明:
1、在启用了RBAC的Kubernetes环境中,为Prometheus配置SA及其相关权限;
2、Prometheus默认使用本地存储,默认路径/prometheus,为其设置PVC;
3、使用CM配置Prometheus的prometheus.yml配置文件,挂载到默认路径/etc/prometheus/prometheus.yml;
关于/etc/prometheus/prometheus.yml的配置参考:官方文档。
关于采集Kubernetes指标的配置参考:官方事例。
关于relabel_configs的配置参考:官方文档。
4、以Deployment部署Prometheus实例并配置相应的SVC,使用NodePort暴露服务;
特别注意:
在挂载prometheus-data-volume的时候,默认情况下,挂载点属于root用户,其他用户没有写入的权限,而Prometheus默认的运行用户是nobody:nogroup,所以在在默认情况下直接挂载/prometheus将导致prometheus启动失败,解决办法:
      serviceAccountName: prometheus
      securityContext:
        runAsUser: 65534
        fsGroup: 65534
      containers:
nobody:nogroup的UID和GID都是65534,可以通过容器内的/etc/passwd查看!
- 部署Prometheus
root@master:~/kubernetes/prometheus# kubectl apply -f prometheus.yml

root@master:~/kubernetes/prometheus# kubectl get pods -n ns-monitor -o wide
NAME                         READY     STATUS    RESTARTS   AGE       IP                NODE
node-exporter-br7wz          1/1       Running   0          6h        192.168.115.210   master
node-exporter-jzc6f          1/1       Running   0          6h        192.168.115.212   node2
node-exporter-t9s2f          1/1       Running   0          6h        192.168.115.213   node3
node-exporter-trh52          1/1       Running   0          6h        192.168.115.211   node1
prometheus-985cd7c77-766sc 1/1 Running 0 20m 10.233.71.47 node3- 查看Prometheus的Web UI
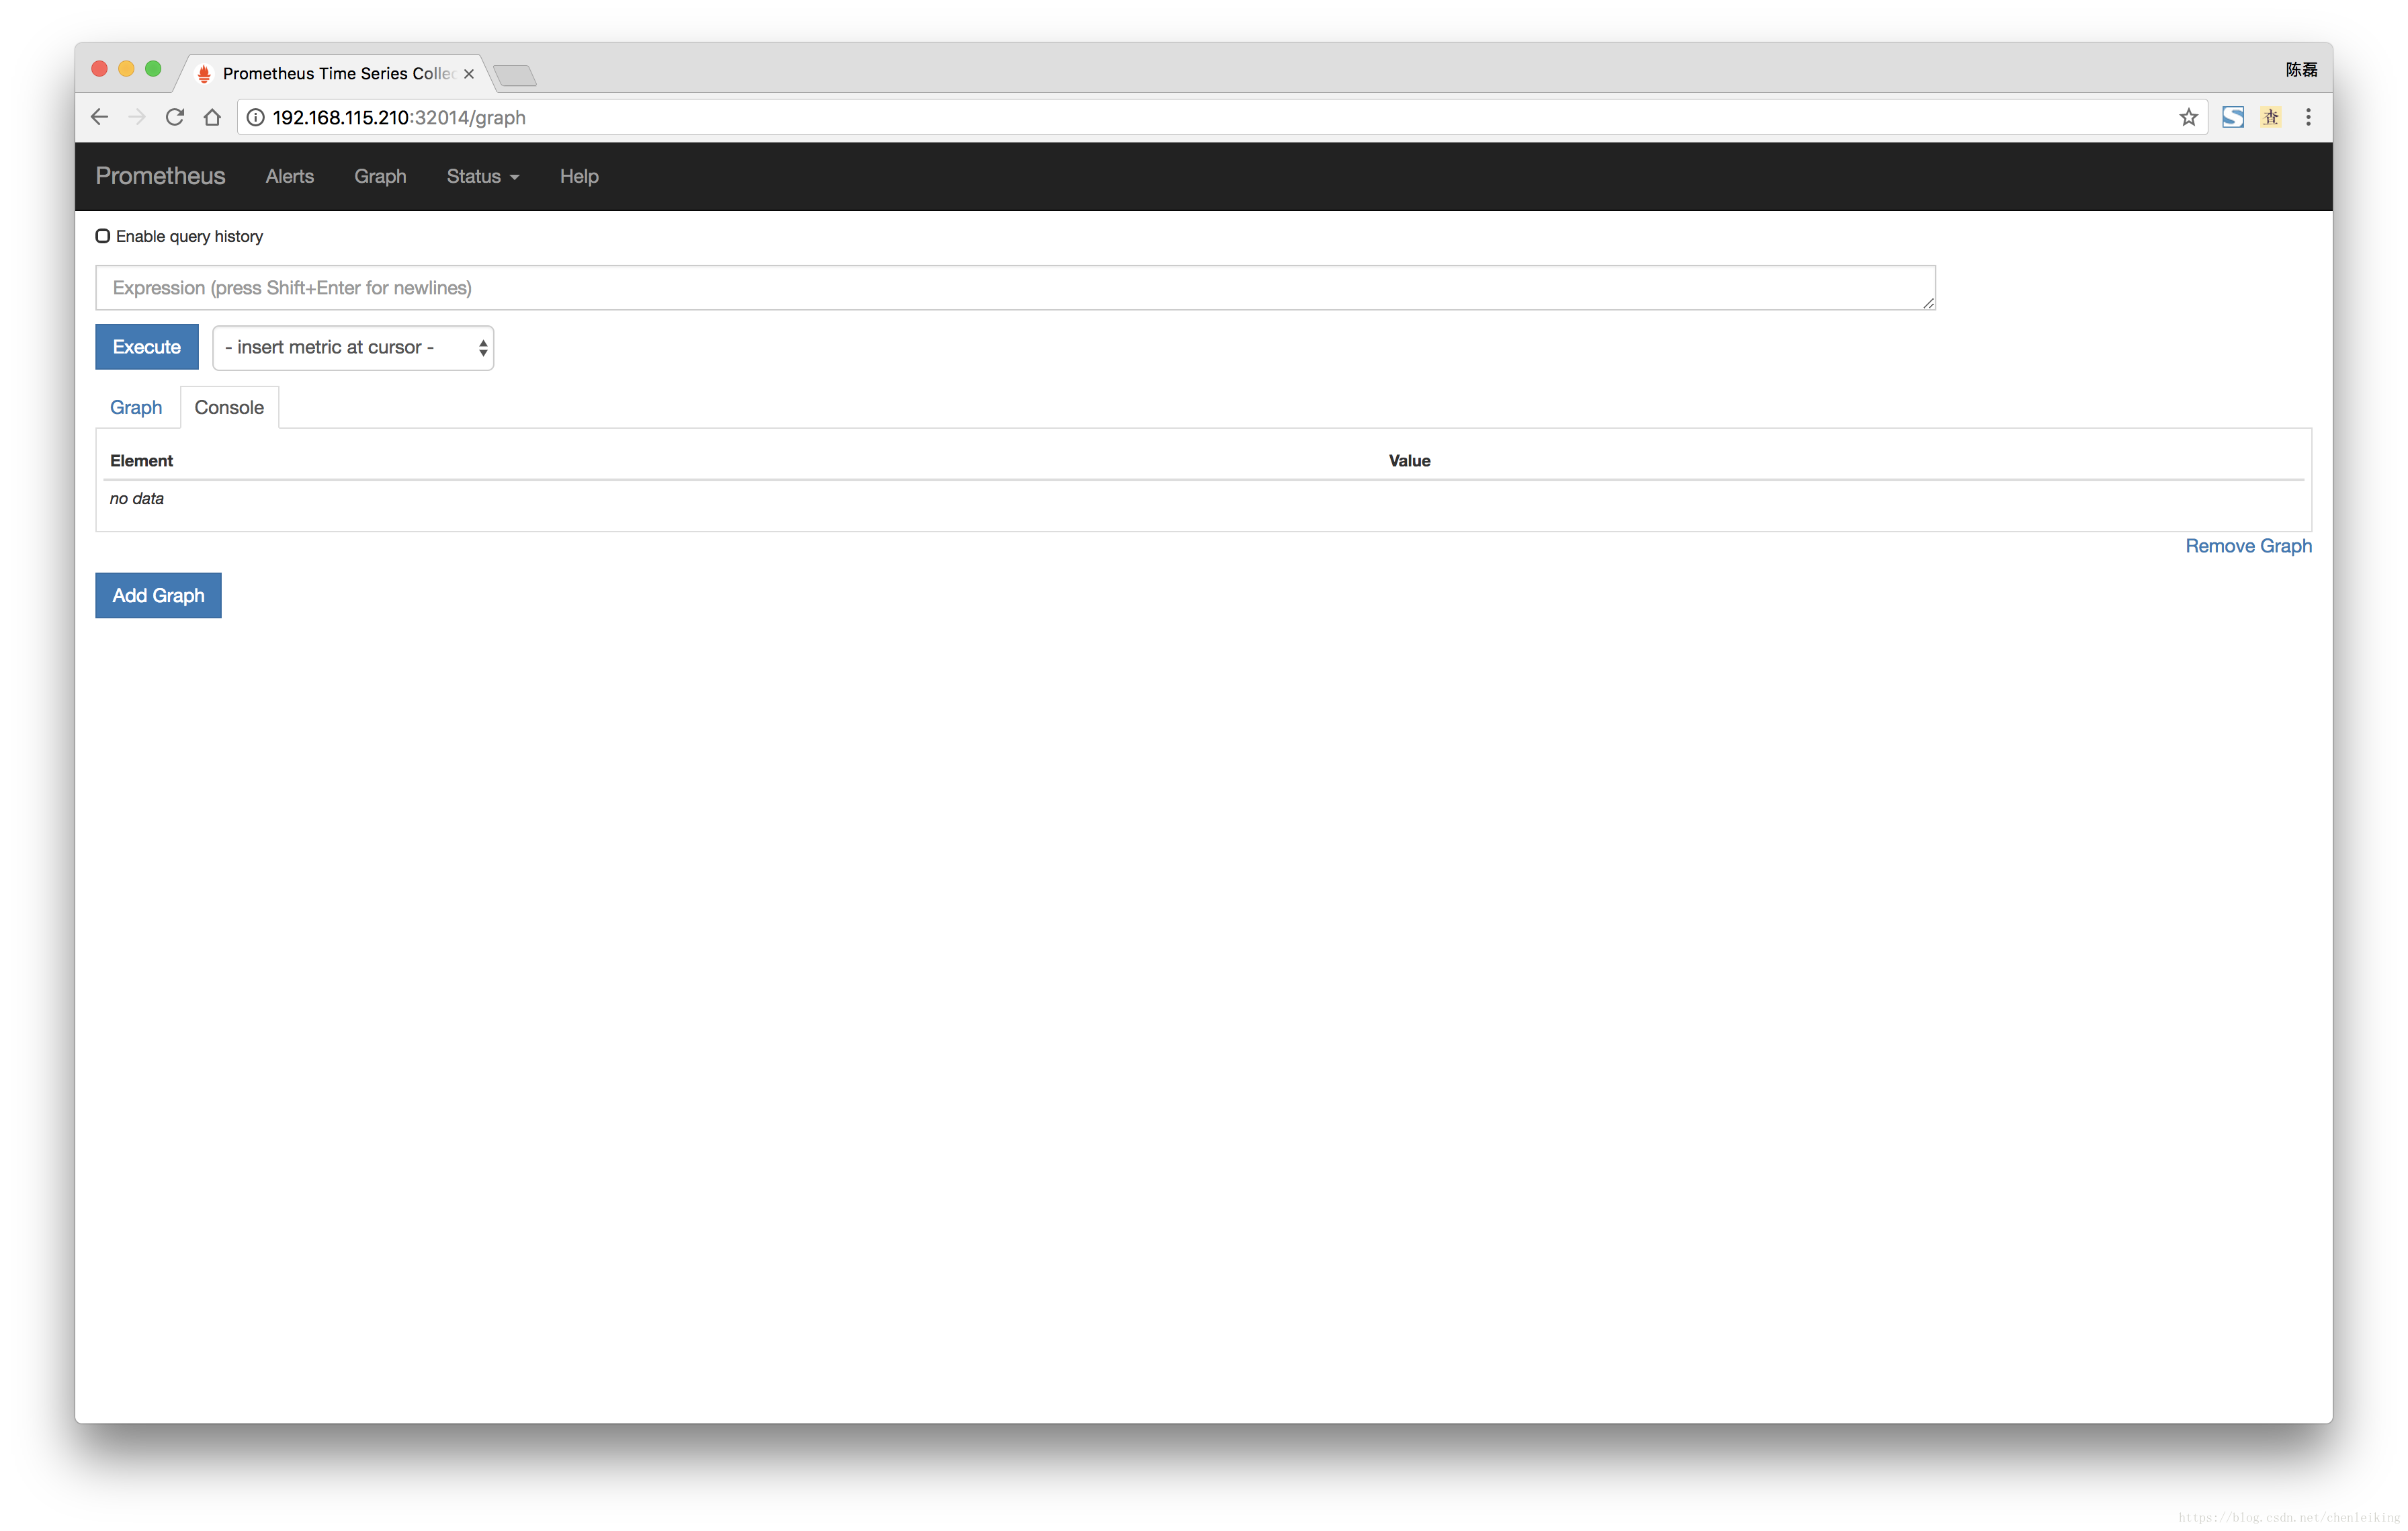
使用浏览器访问Prometheus SVC对应的NodePort
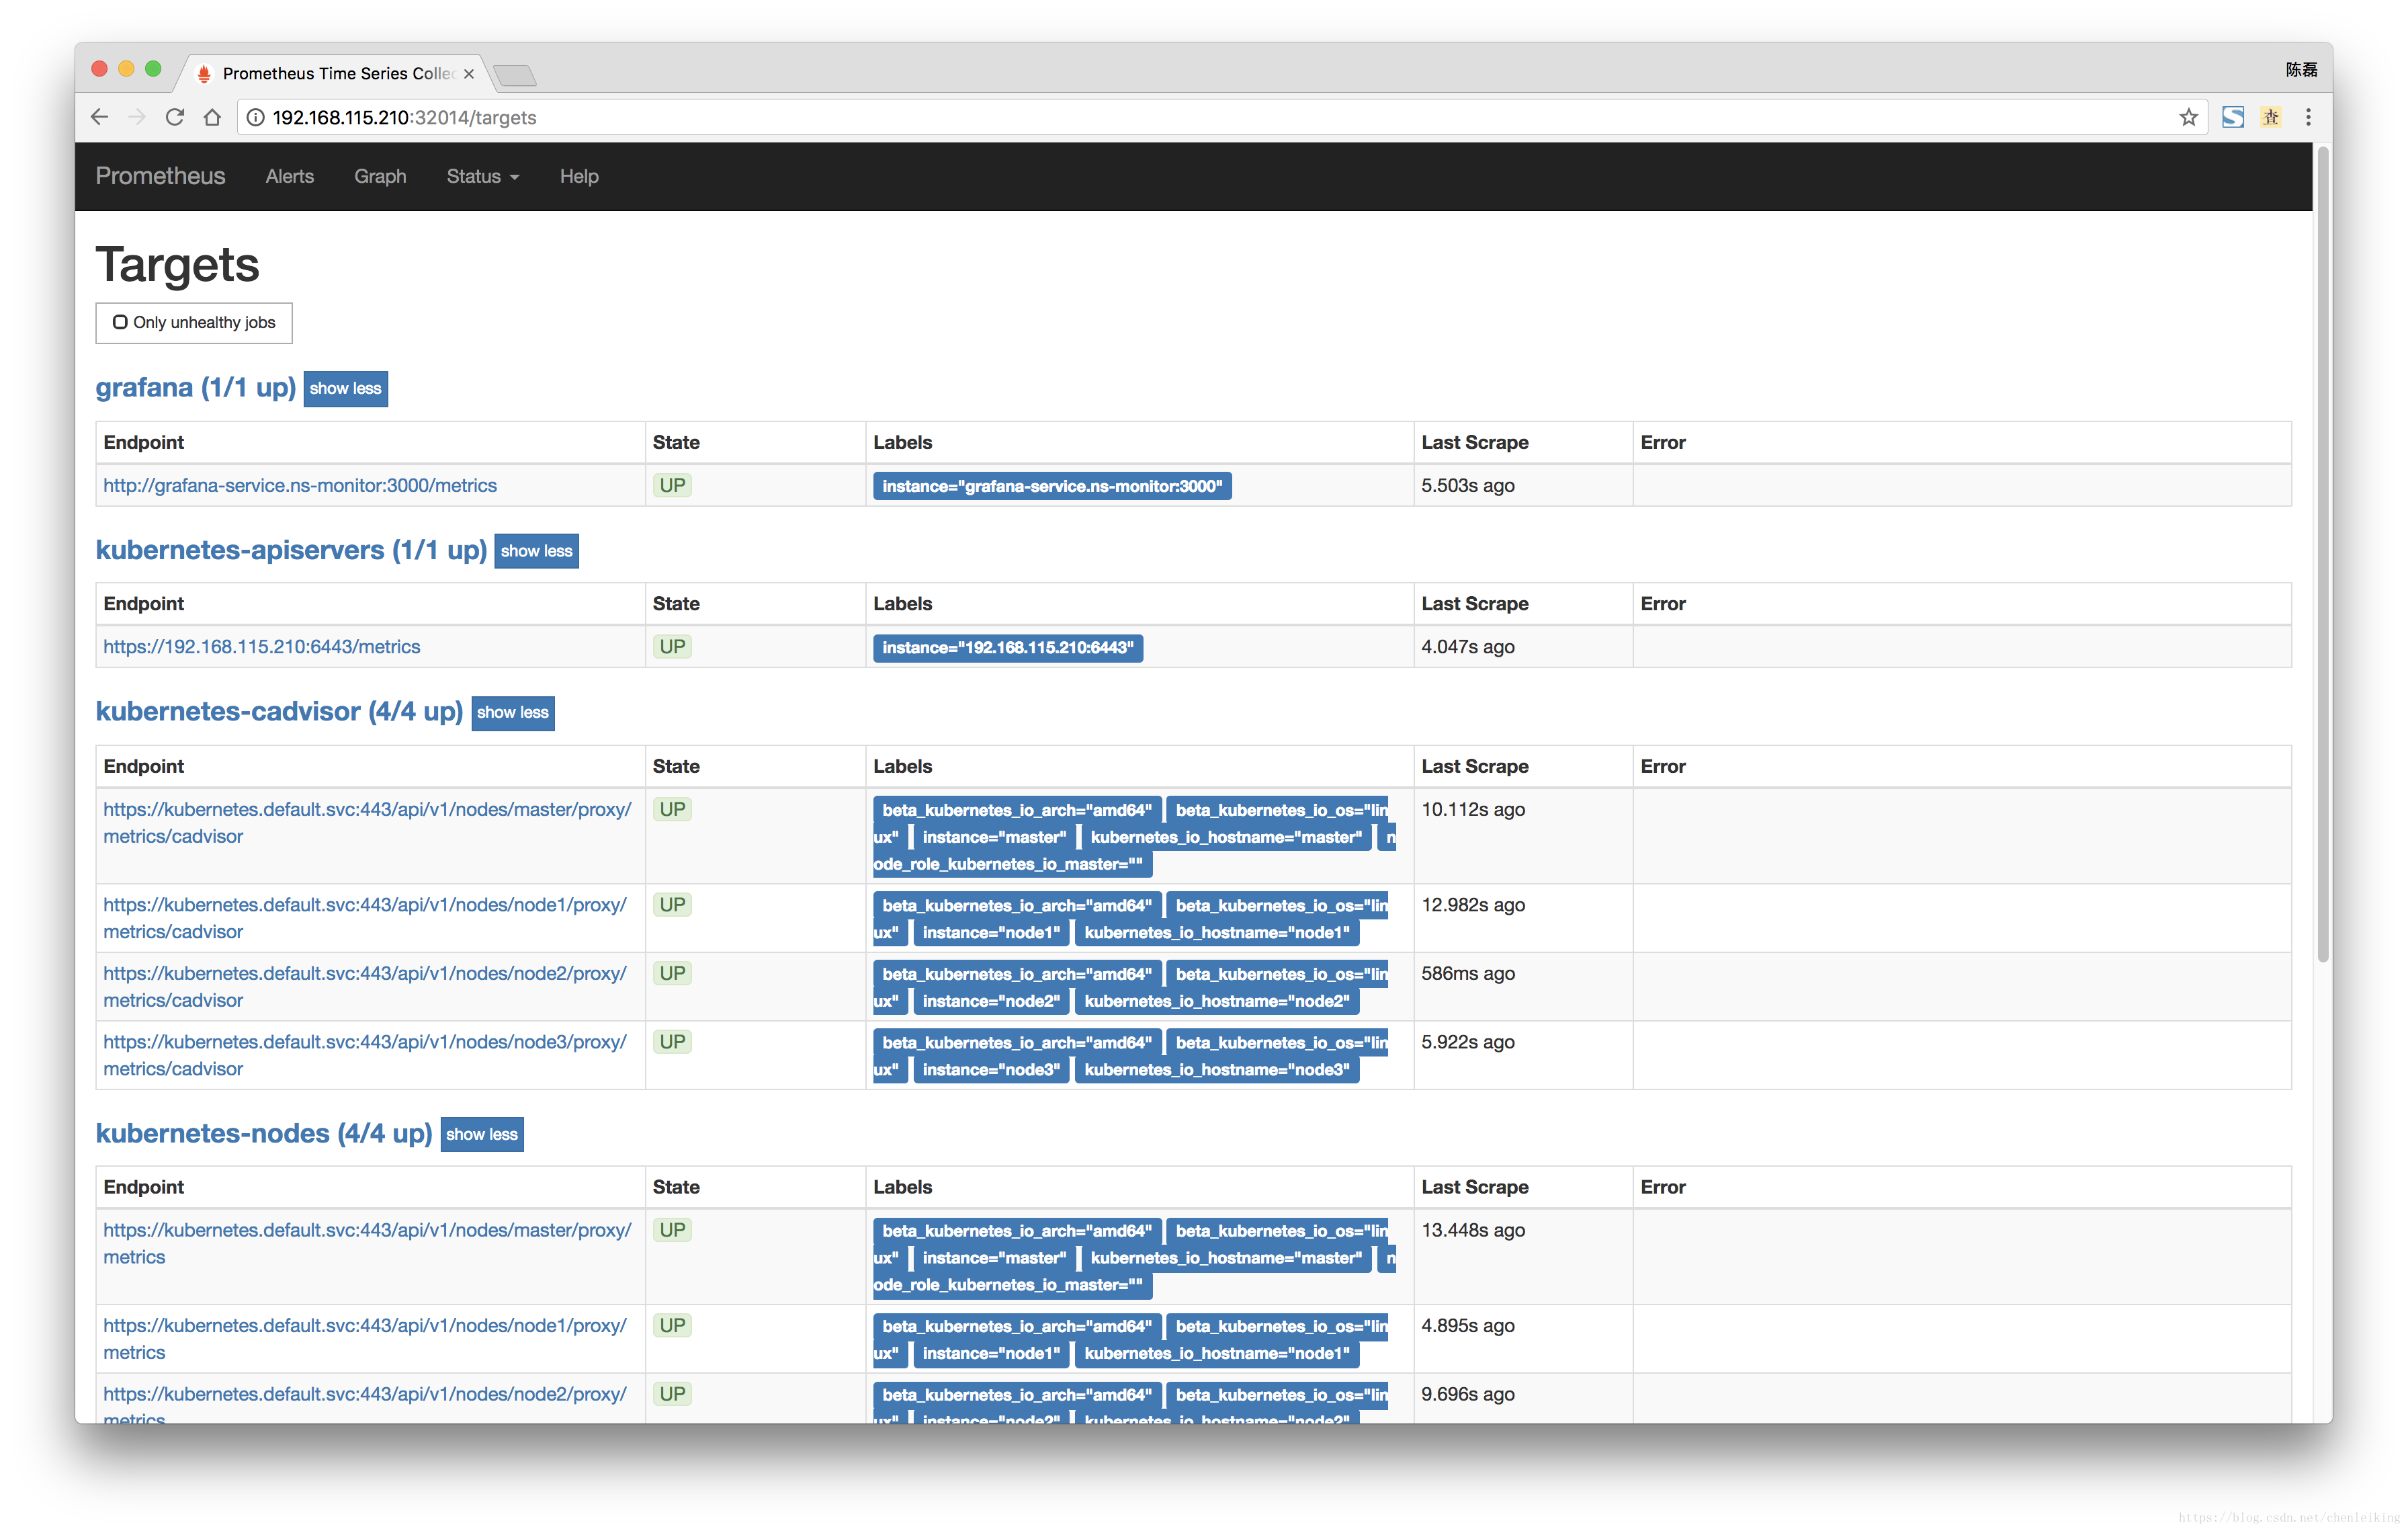
- 查看target
- 查看service-discovery
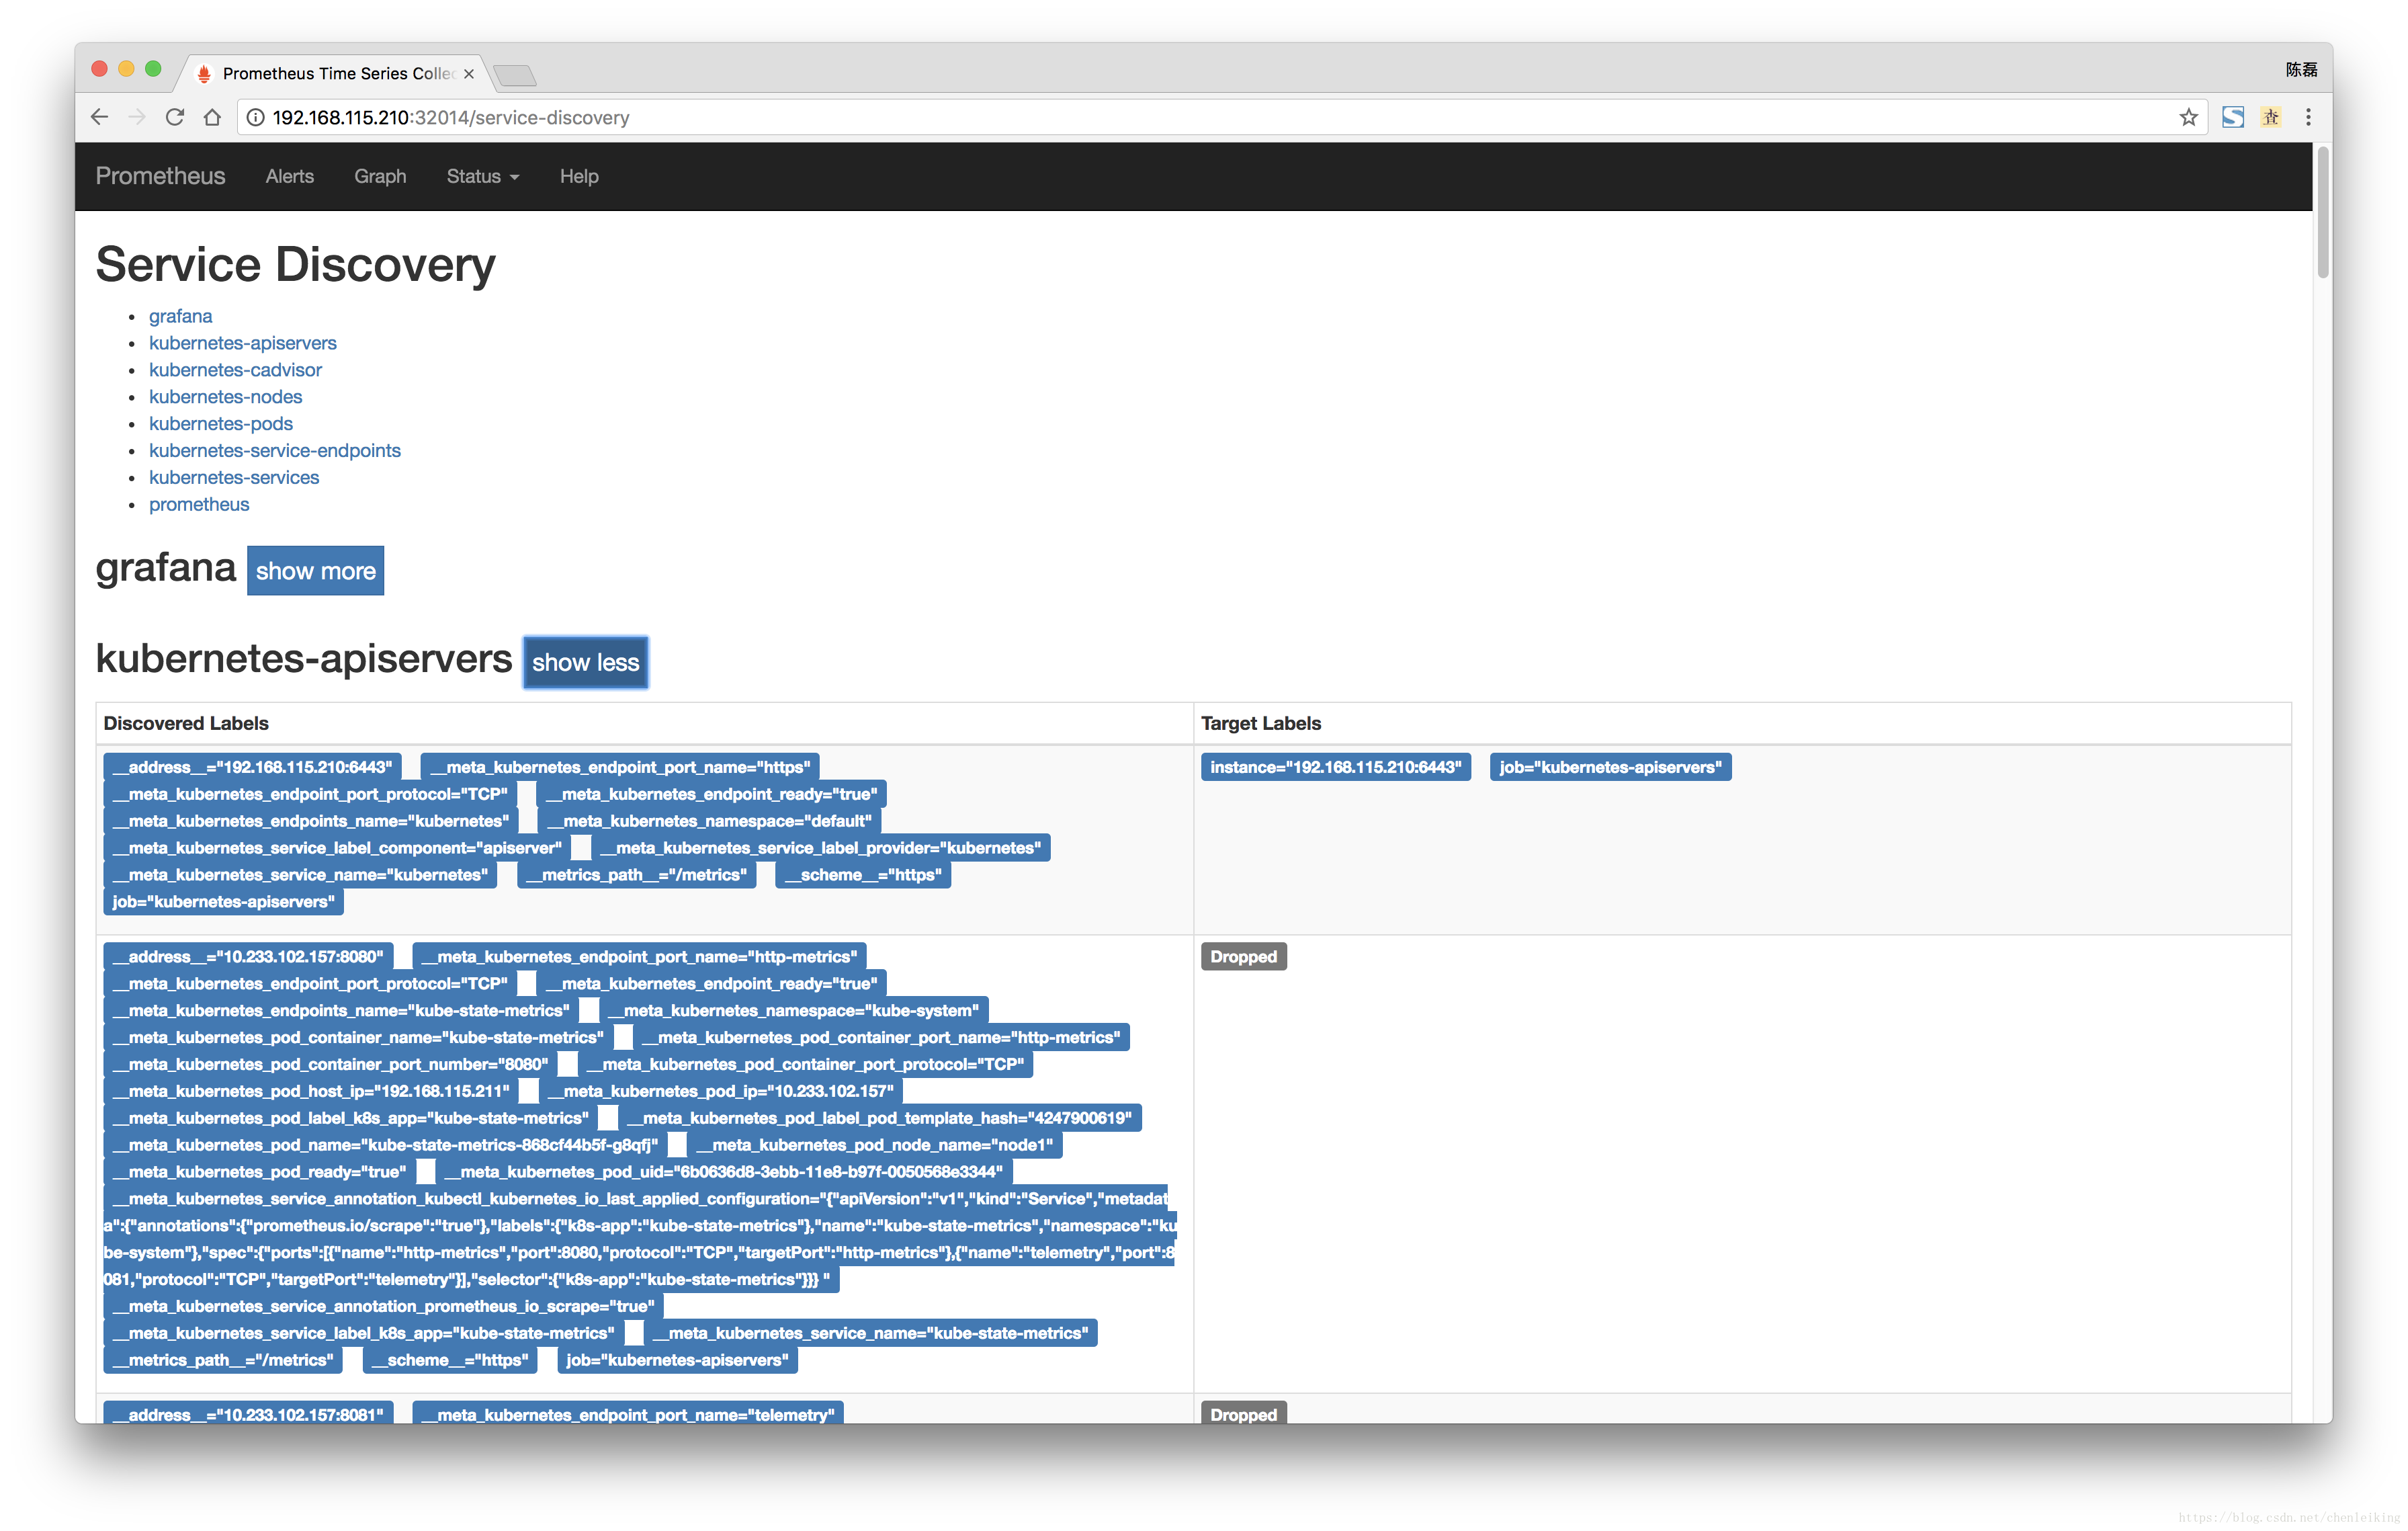
Prometheus会根据/etc/prometheus/promethues.yml中的relabel_configs配置对指标进行处理,比如:dropped、replace等
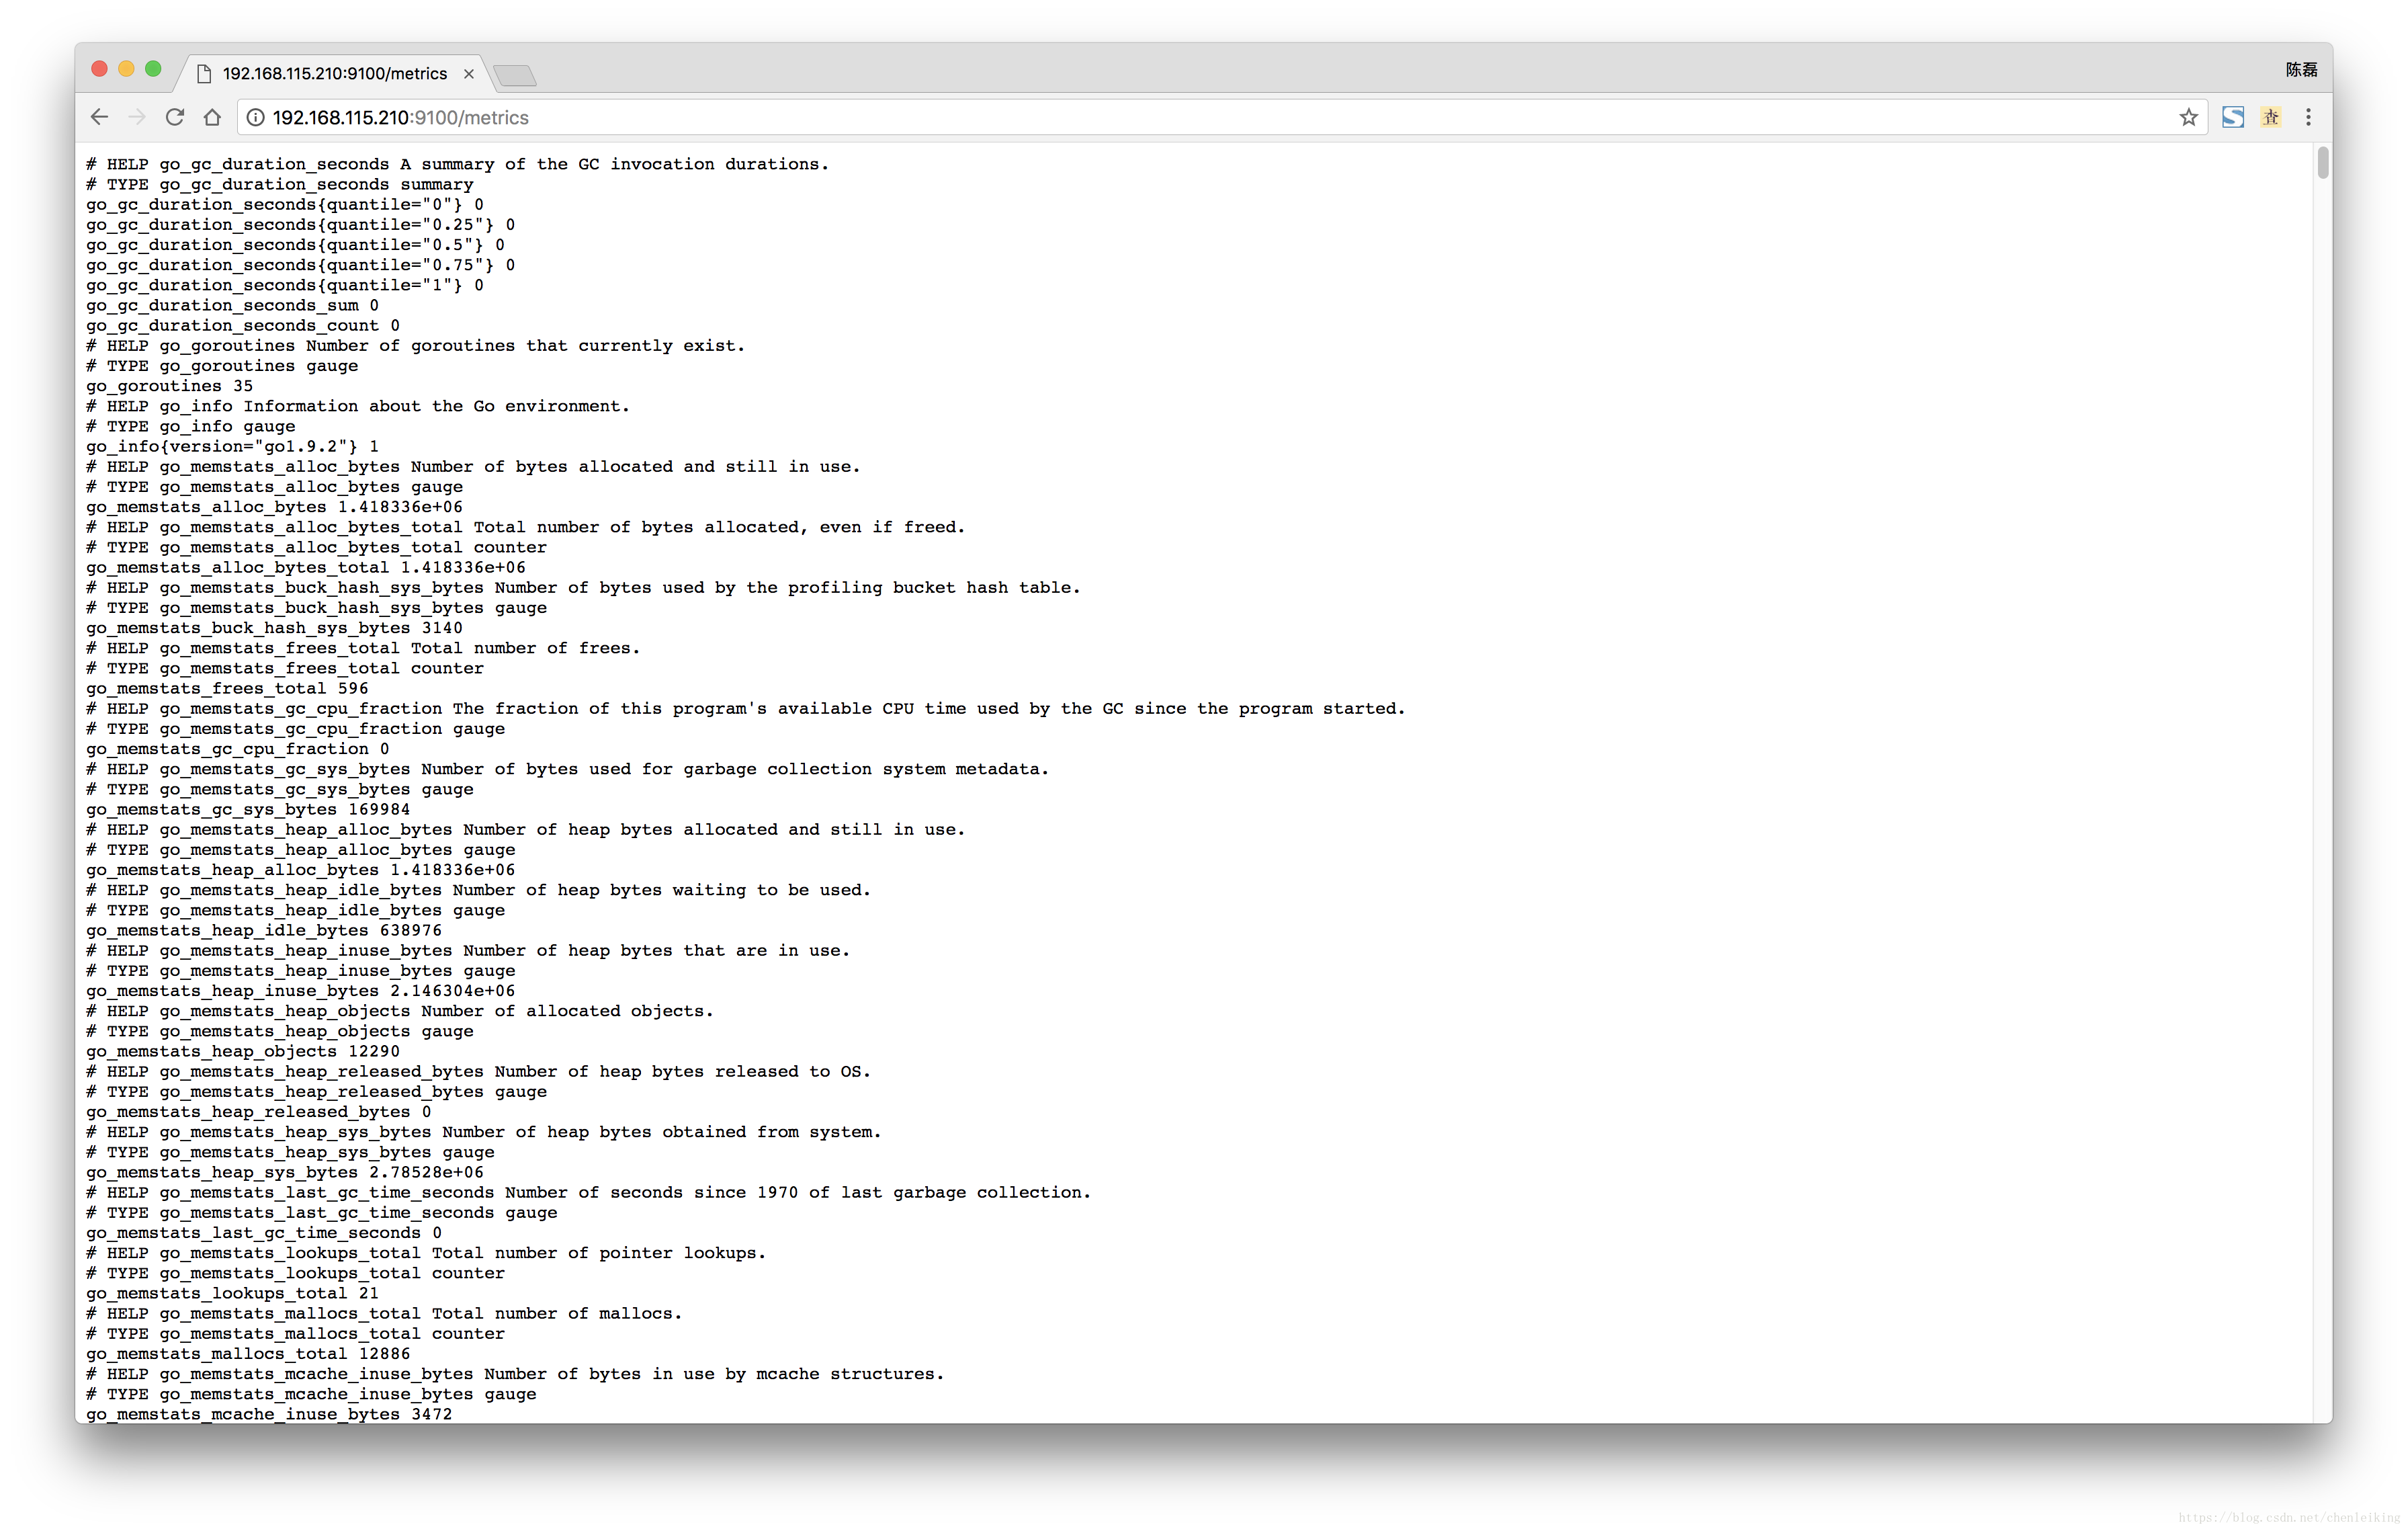
- Prometheus自己的指标
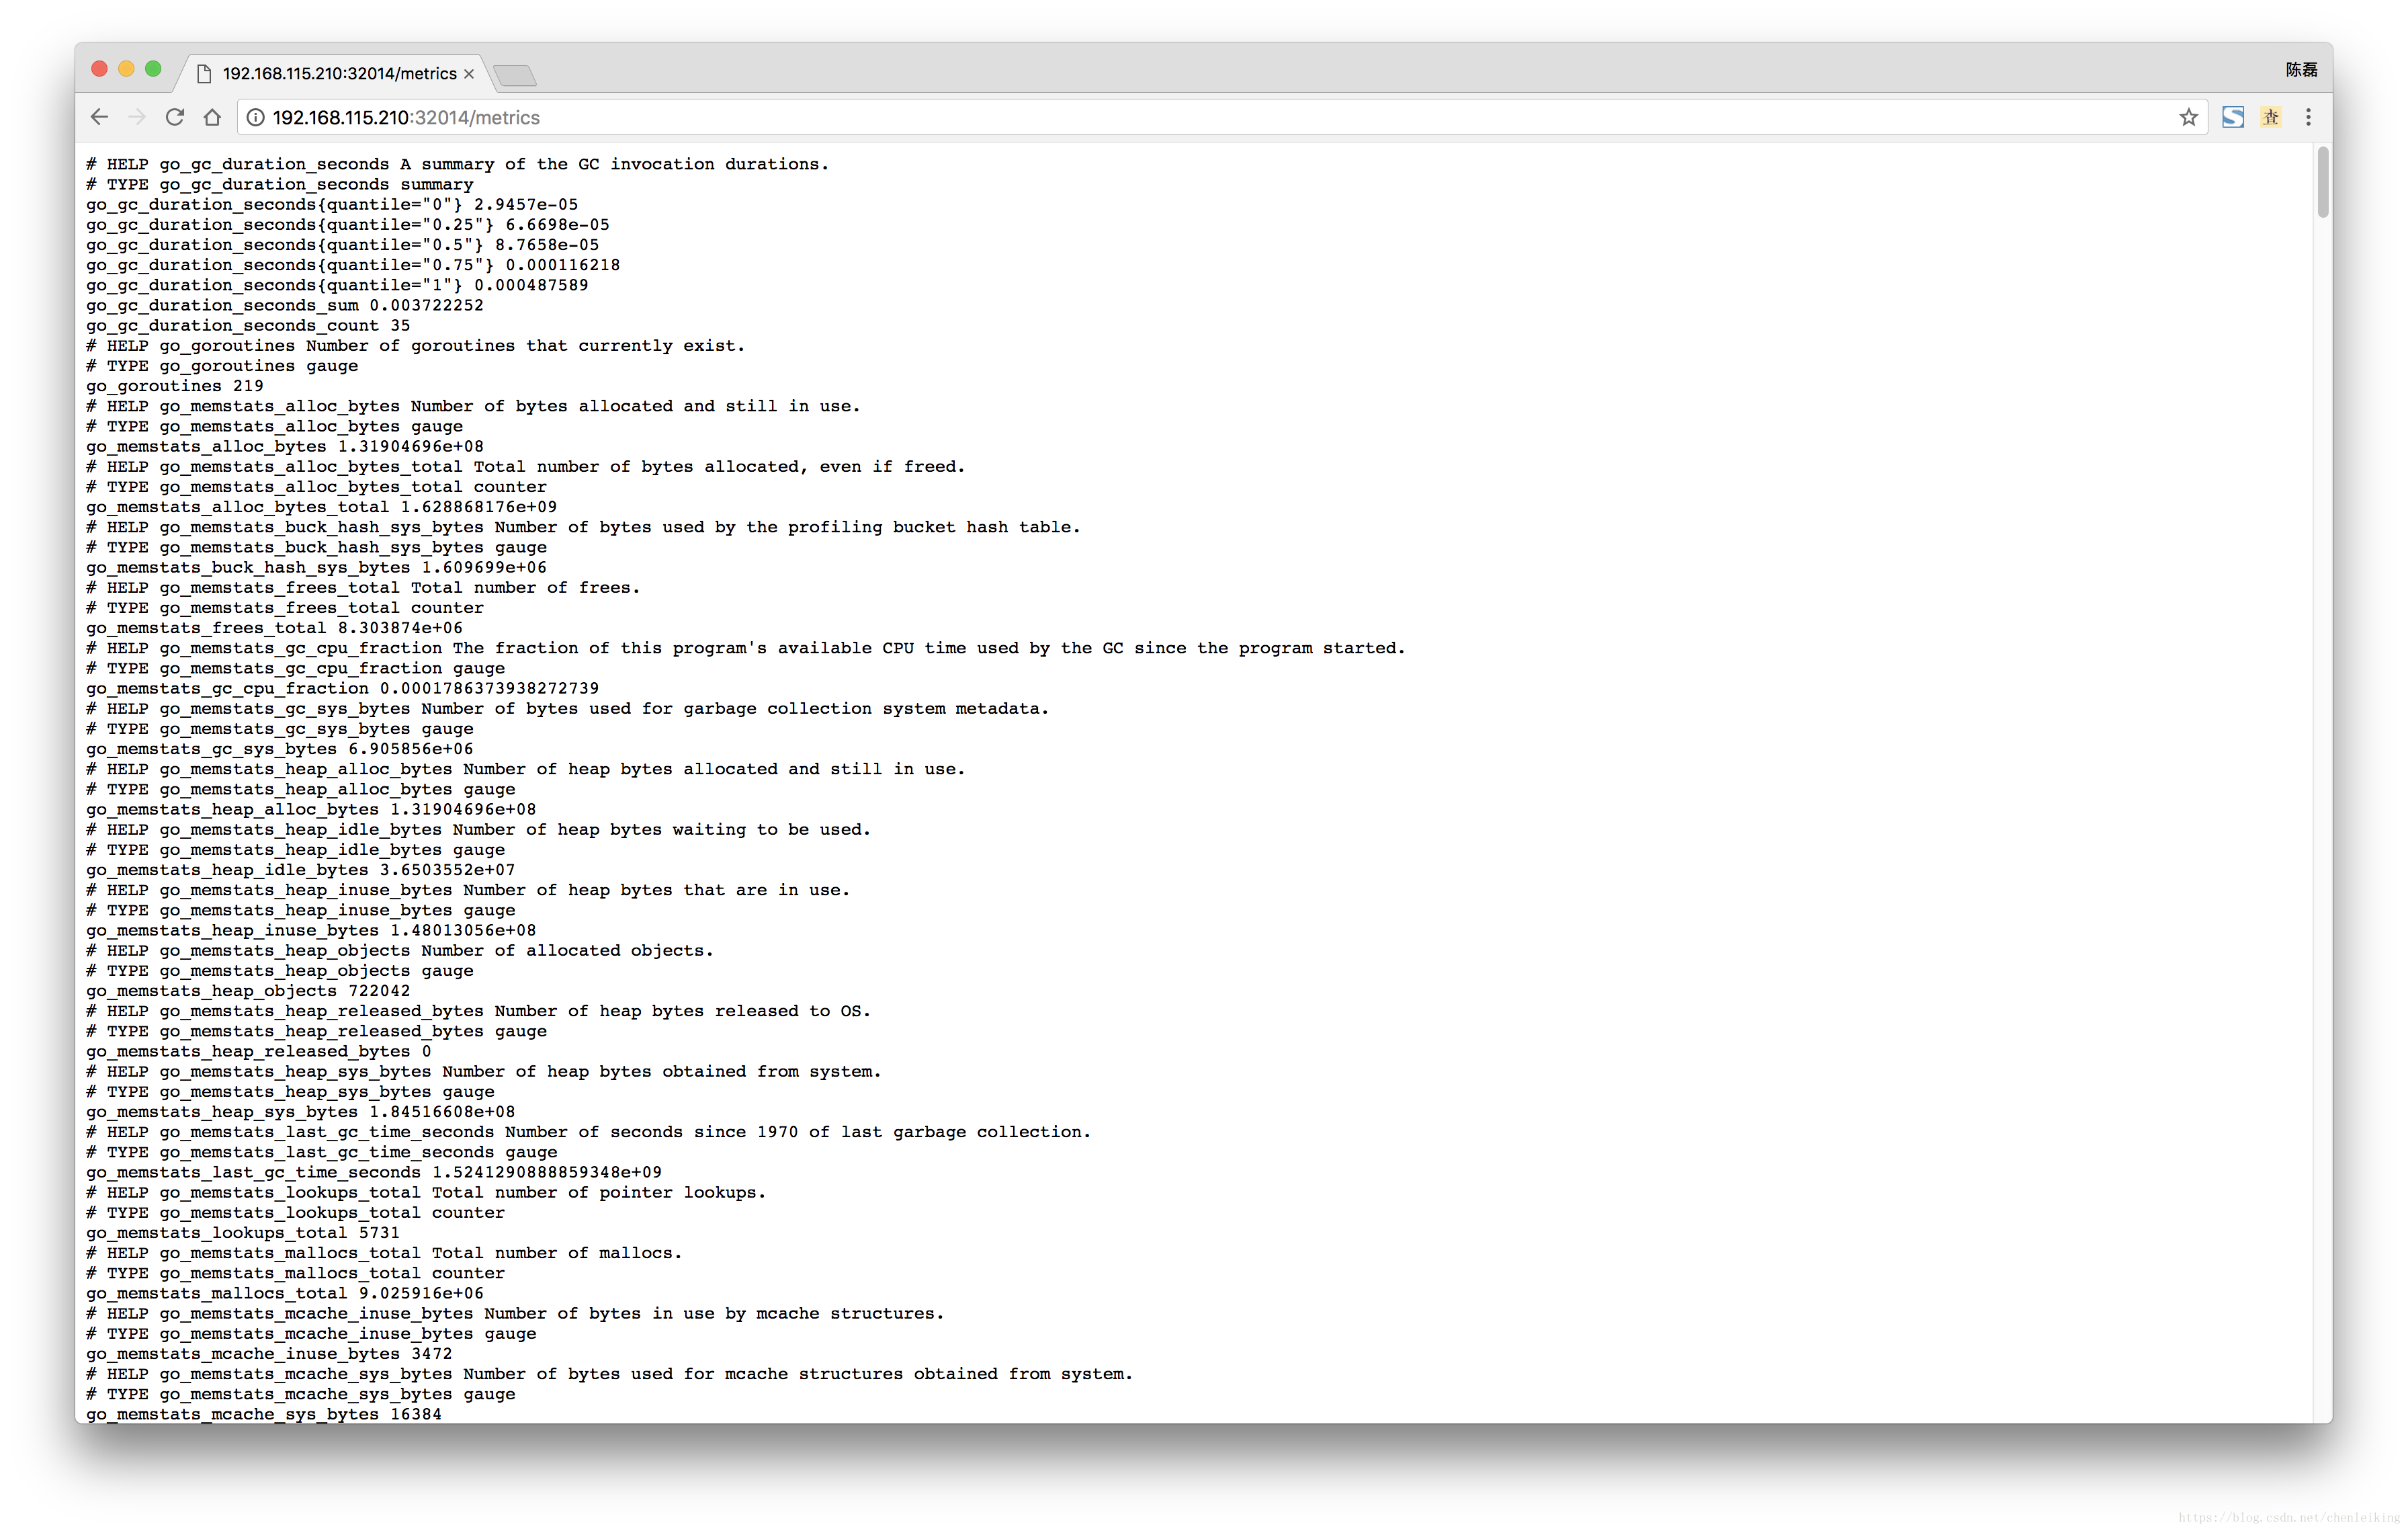
浏览器访问/metrics
2.4、部署grafana
- grafana.yml文件内容
apiVersion: v1
kind: PersistentVolume
metadata:
  name: "grafana-data-pv"
  labels:
    name: grafana-data-pv
    release: stable
spec:
  capacity:
    storage: 5Gi
  accessModes:
    - ReadWriteOnce
  persistentVolumeReclaimPolicy: Recycle
  nfs:
    path: /nfs/grafana/data
    server: 192.168.115.210
---
apiVersion: v1
kind: PersistentVolumeClaim
metadata:
  name: grafana-data-pvc
  namespace: ns-monitor
spec:
  accessModes:
    - ReadWriteOnce
  resources:
    requests:
      storage: 5Gi
  selector:
    matchLabels:
      name: grafana-data-pv
      release: stable
---
kind: Deployment
apiVersion: apps/v1beta2
metadata:
  labels:
    app: grafana
  name: grafana
  namespace: ns-monitor
spec:
  replicas: 1
  revisionHistoryLimit: 10
  selector:
    matchLabels:
      app: grafana
  template:
    metadata:
      labels:
        app: grafana
    spec:
      containers:
        - name: grafana
          image: 192.168.101.88:5000/grafana/grafana:5.0.4
          env:
            - name: GF_AUTH_BASIC_ENABLED
              value: "true"
            - name: GF_AUTH_ANONYMOUS_ENABLED
              value: "false"
          readinessProbe:
            httpGet:
              path: /login
              port: 3000
          volumeMounts:
            - mountPath: /var/lib/grafana
              name: grafana-data-volume
          ports:
            - containerPort: 3000
              protocol: TCP
      volumes:
        - name: grafana-data-volume
          persistentVolumeClaim:
            claimName: grafana-data-pvc
---
kind: Service
apiVersion: v1
metadata:
  labels:
    app: grafana
  name: grafana-service
  namespace: ns-monitor
spec:
  ports:
    - port: 3000
      targetPort: 3000
  selector:
    app: grafana
  type: NodePort
说明:
1、使用NFS存储Grafana数据、启用基础权限认证、禁用匿名访问;
- 部署Grafana
root@master:~/kubernetes/prometheus# kubectl apply -f grafana.yml

root@master:~/kubernetes/prometheus# kubectl get pods -n ns-monitor -o wide
NAME                         READY     STATUS    RESTARTS   AGE       IP                NODE
grafana-55494b59d6-6k4km     1/1       Running   0          2d        10.233.71.0       node3
node-exporter-br7wz          1/1       Running   0          6h        192.168.115.210   master
node-exporter-jzc6f          1/1       Running   0          6h        192.168.115.212   node2
node-exporter-t9s2f          1/1       Running   0          6h        192.168.115.213   node3
node-exporter-trh52          1/1       Running   0          6h        192.168.115.211   node1
prometheus-985cd7c77-766sc   1/1       Running   0          20m       10.233.71.47      node3
配置Grafana
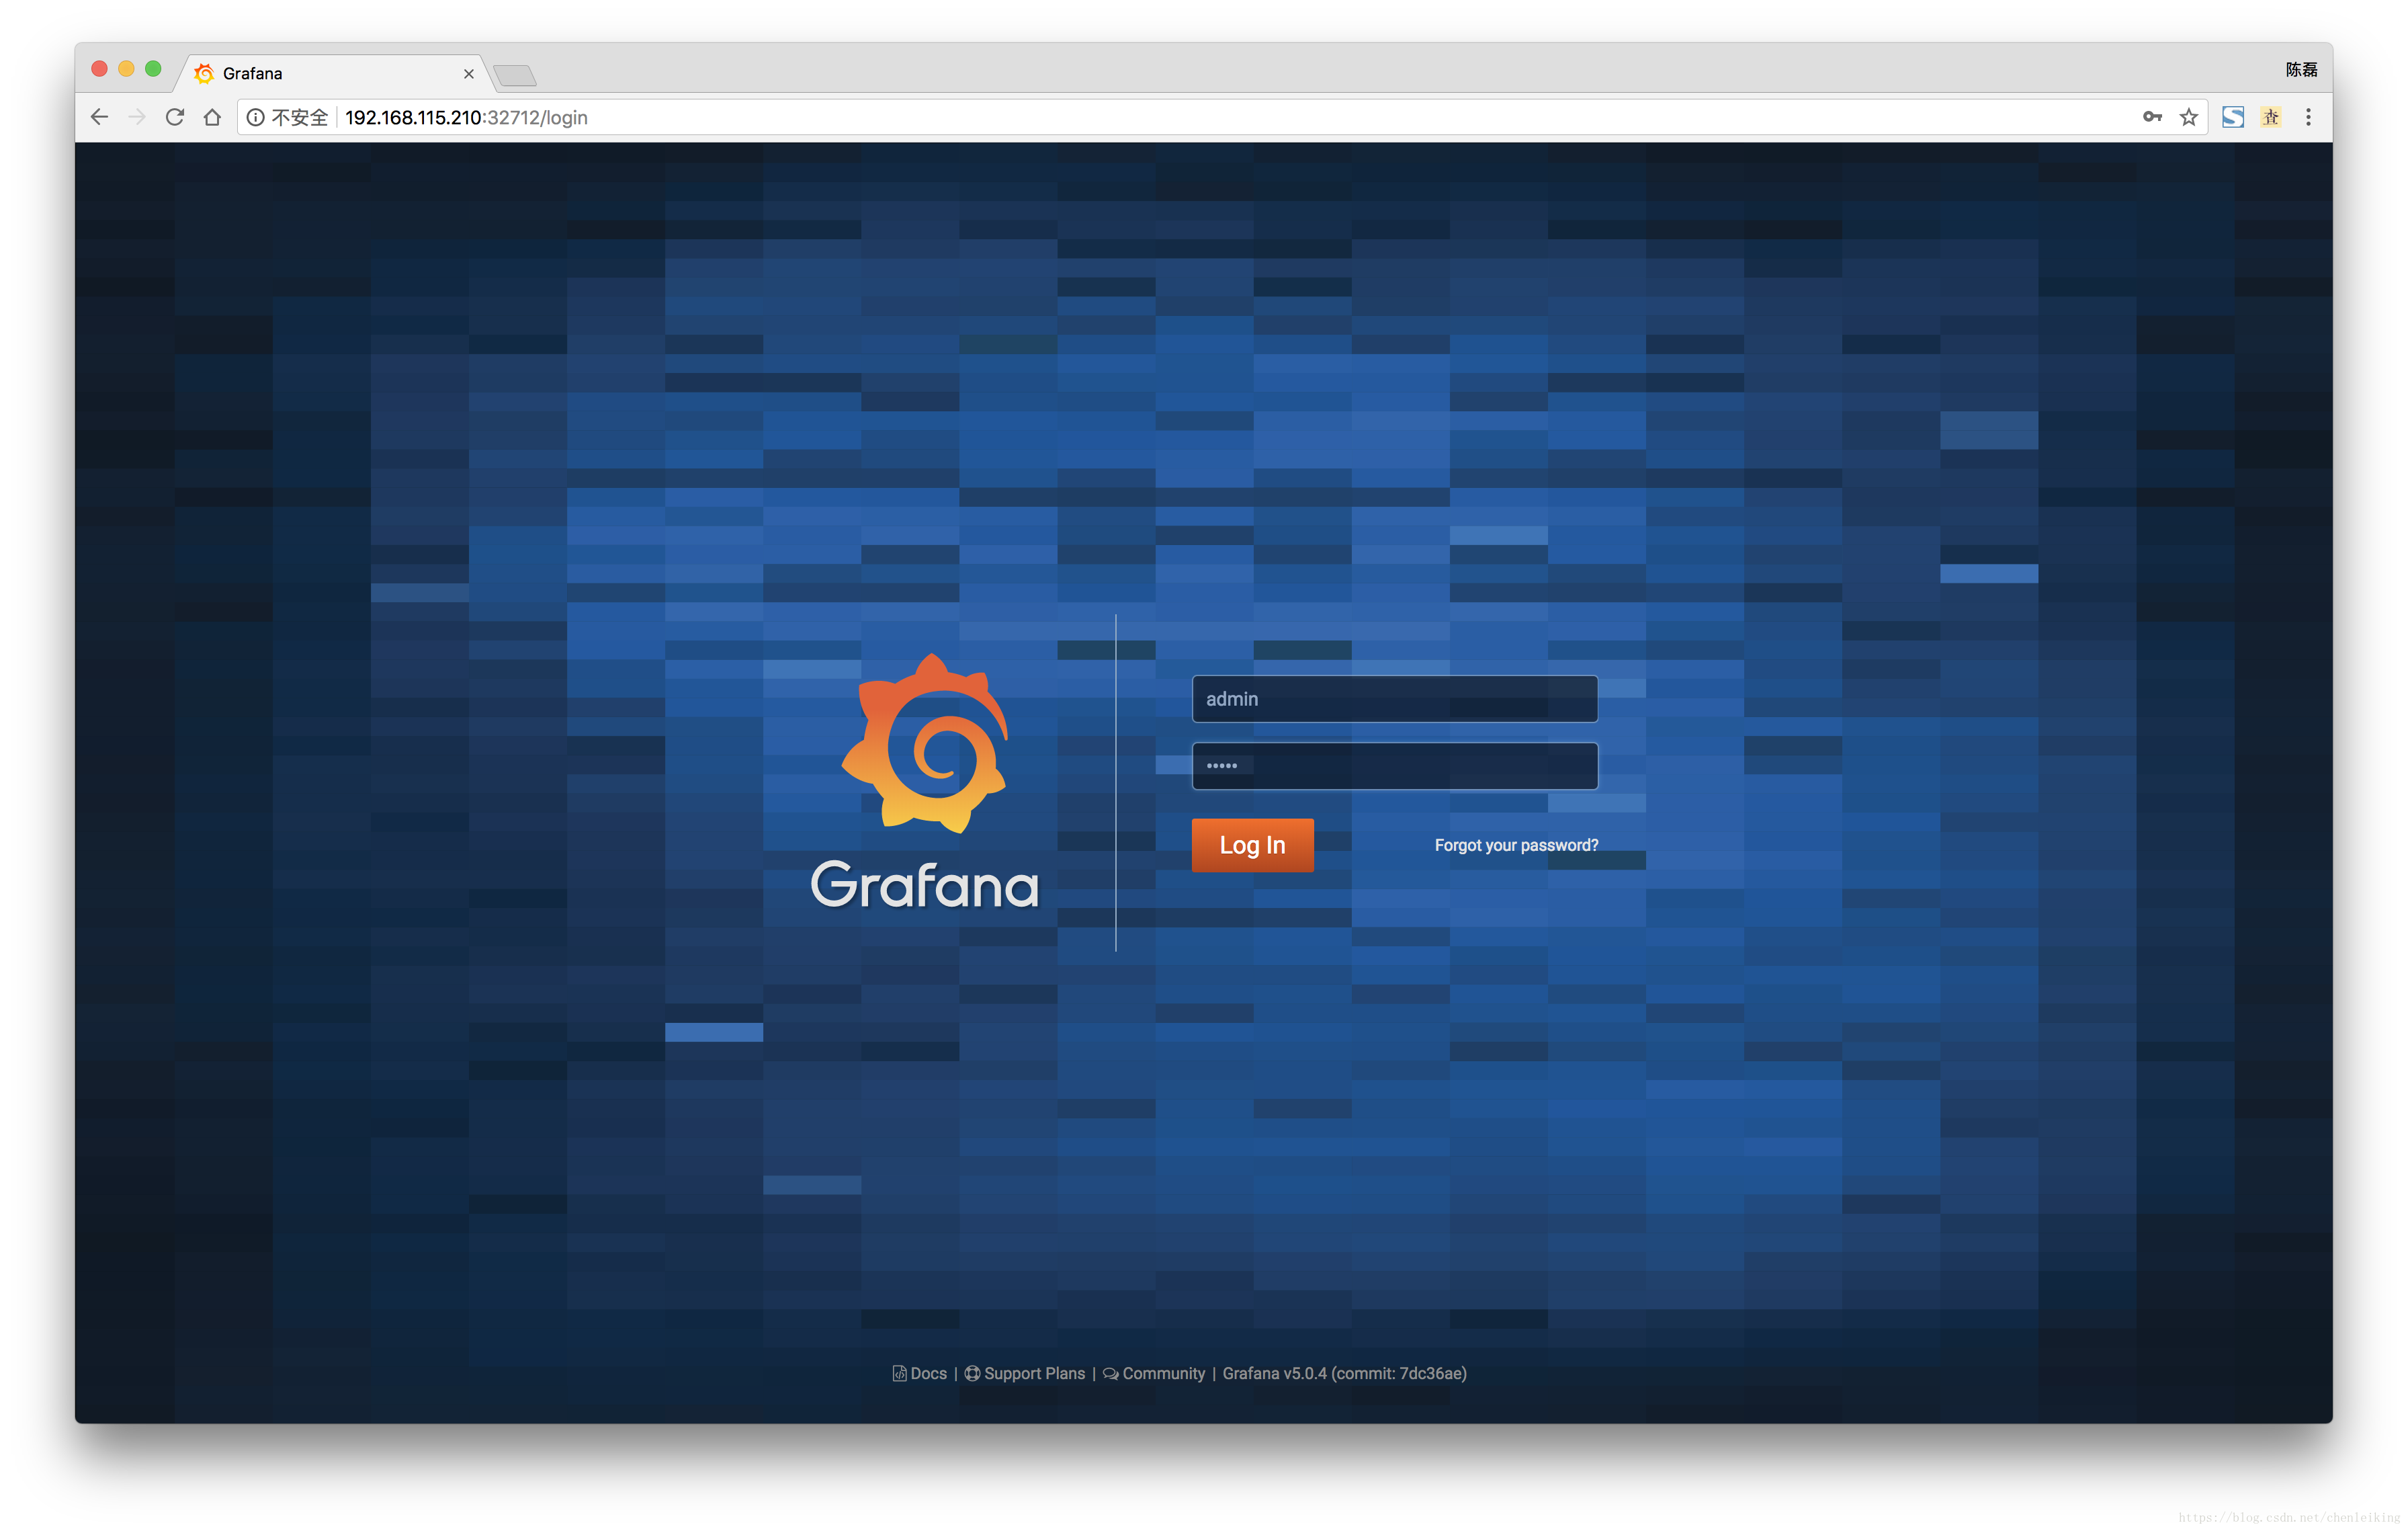
- 登录Grafana,因为使用NodePort暴露服务,通过SVC查看端口,默认用户admin/admin
root@master:~/kubernetes/prometheus# kubectl get svc -n ns-monitor
NAME                    TYPE        CLUSTER-IP      EXTERNAL-IP   PORT(S)          AGE
grafana-service         NodePort    10.233.13.130   <none>        3000:32712/TCP   2d
node-exporter-service   ClusterIP   None            <none>        9100/TCP         6h
prometheus-service      NodePort    10.233.57.158   <none>        9090:32014/TCP   26m
登录之后,跟随Grafana的引导完成设置
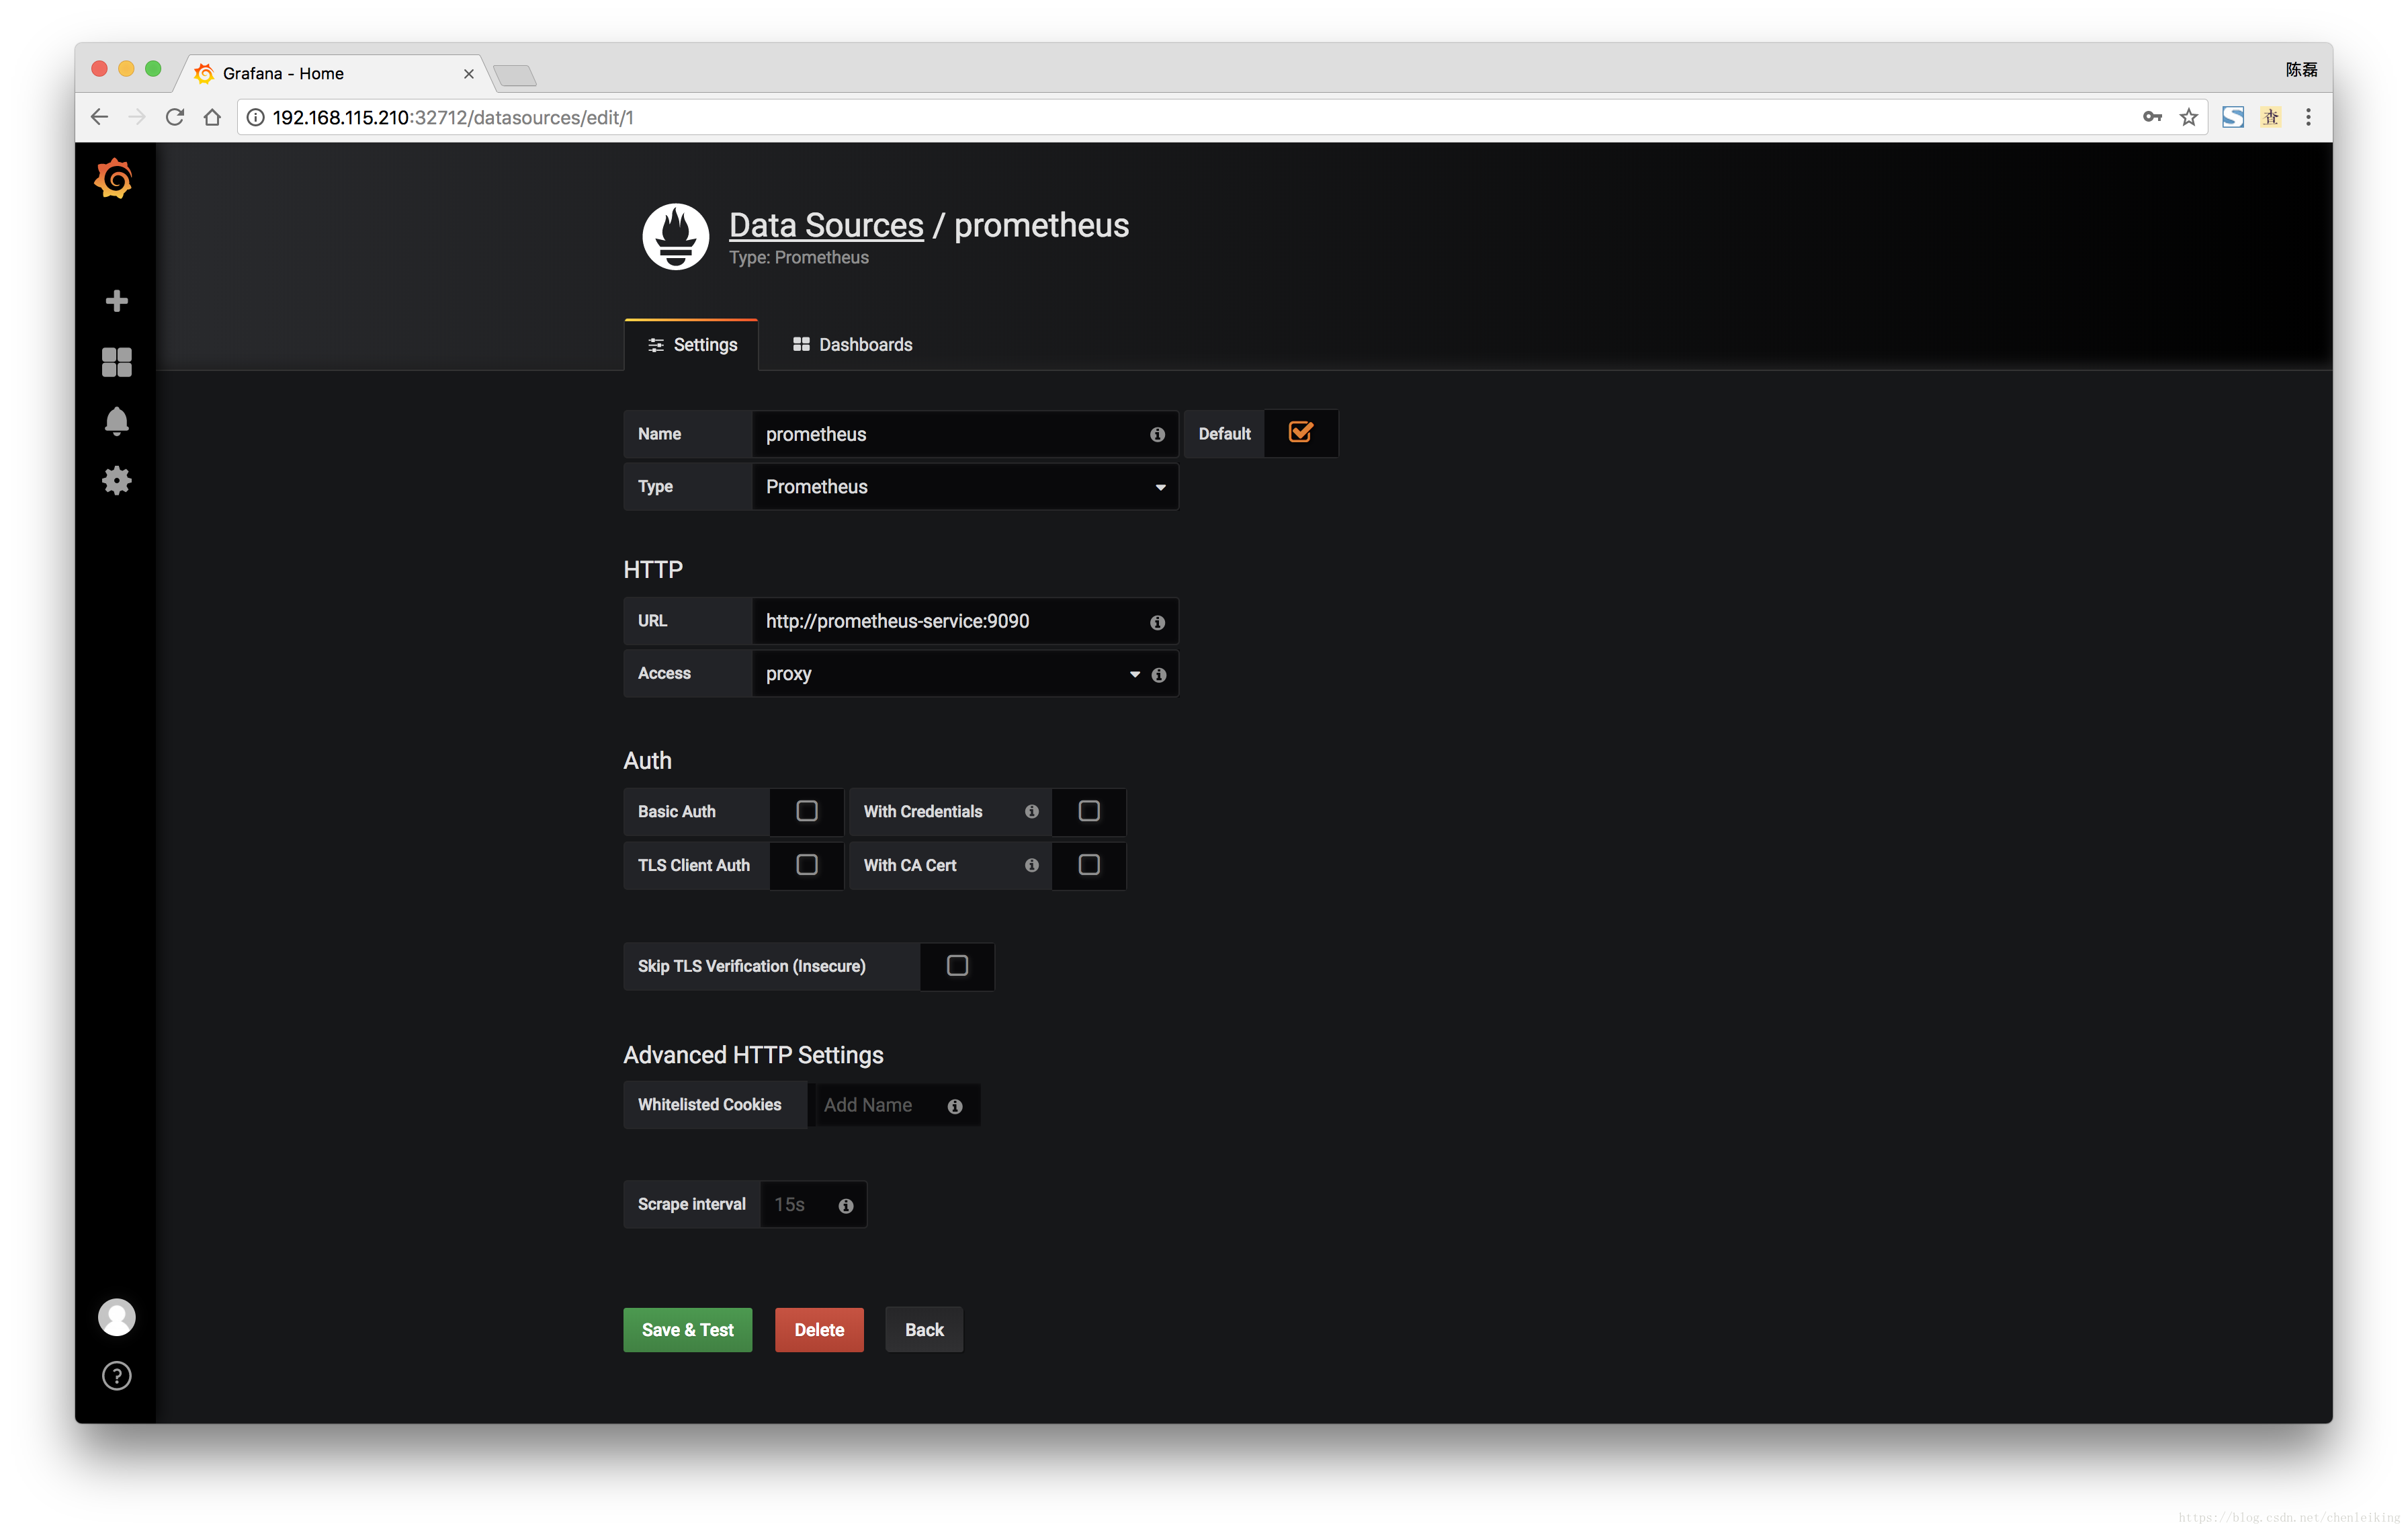
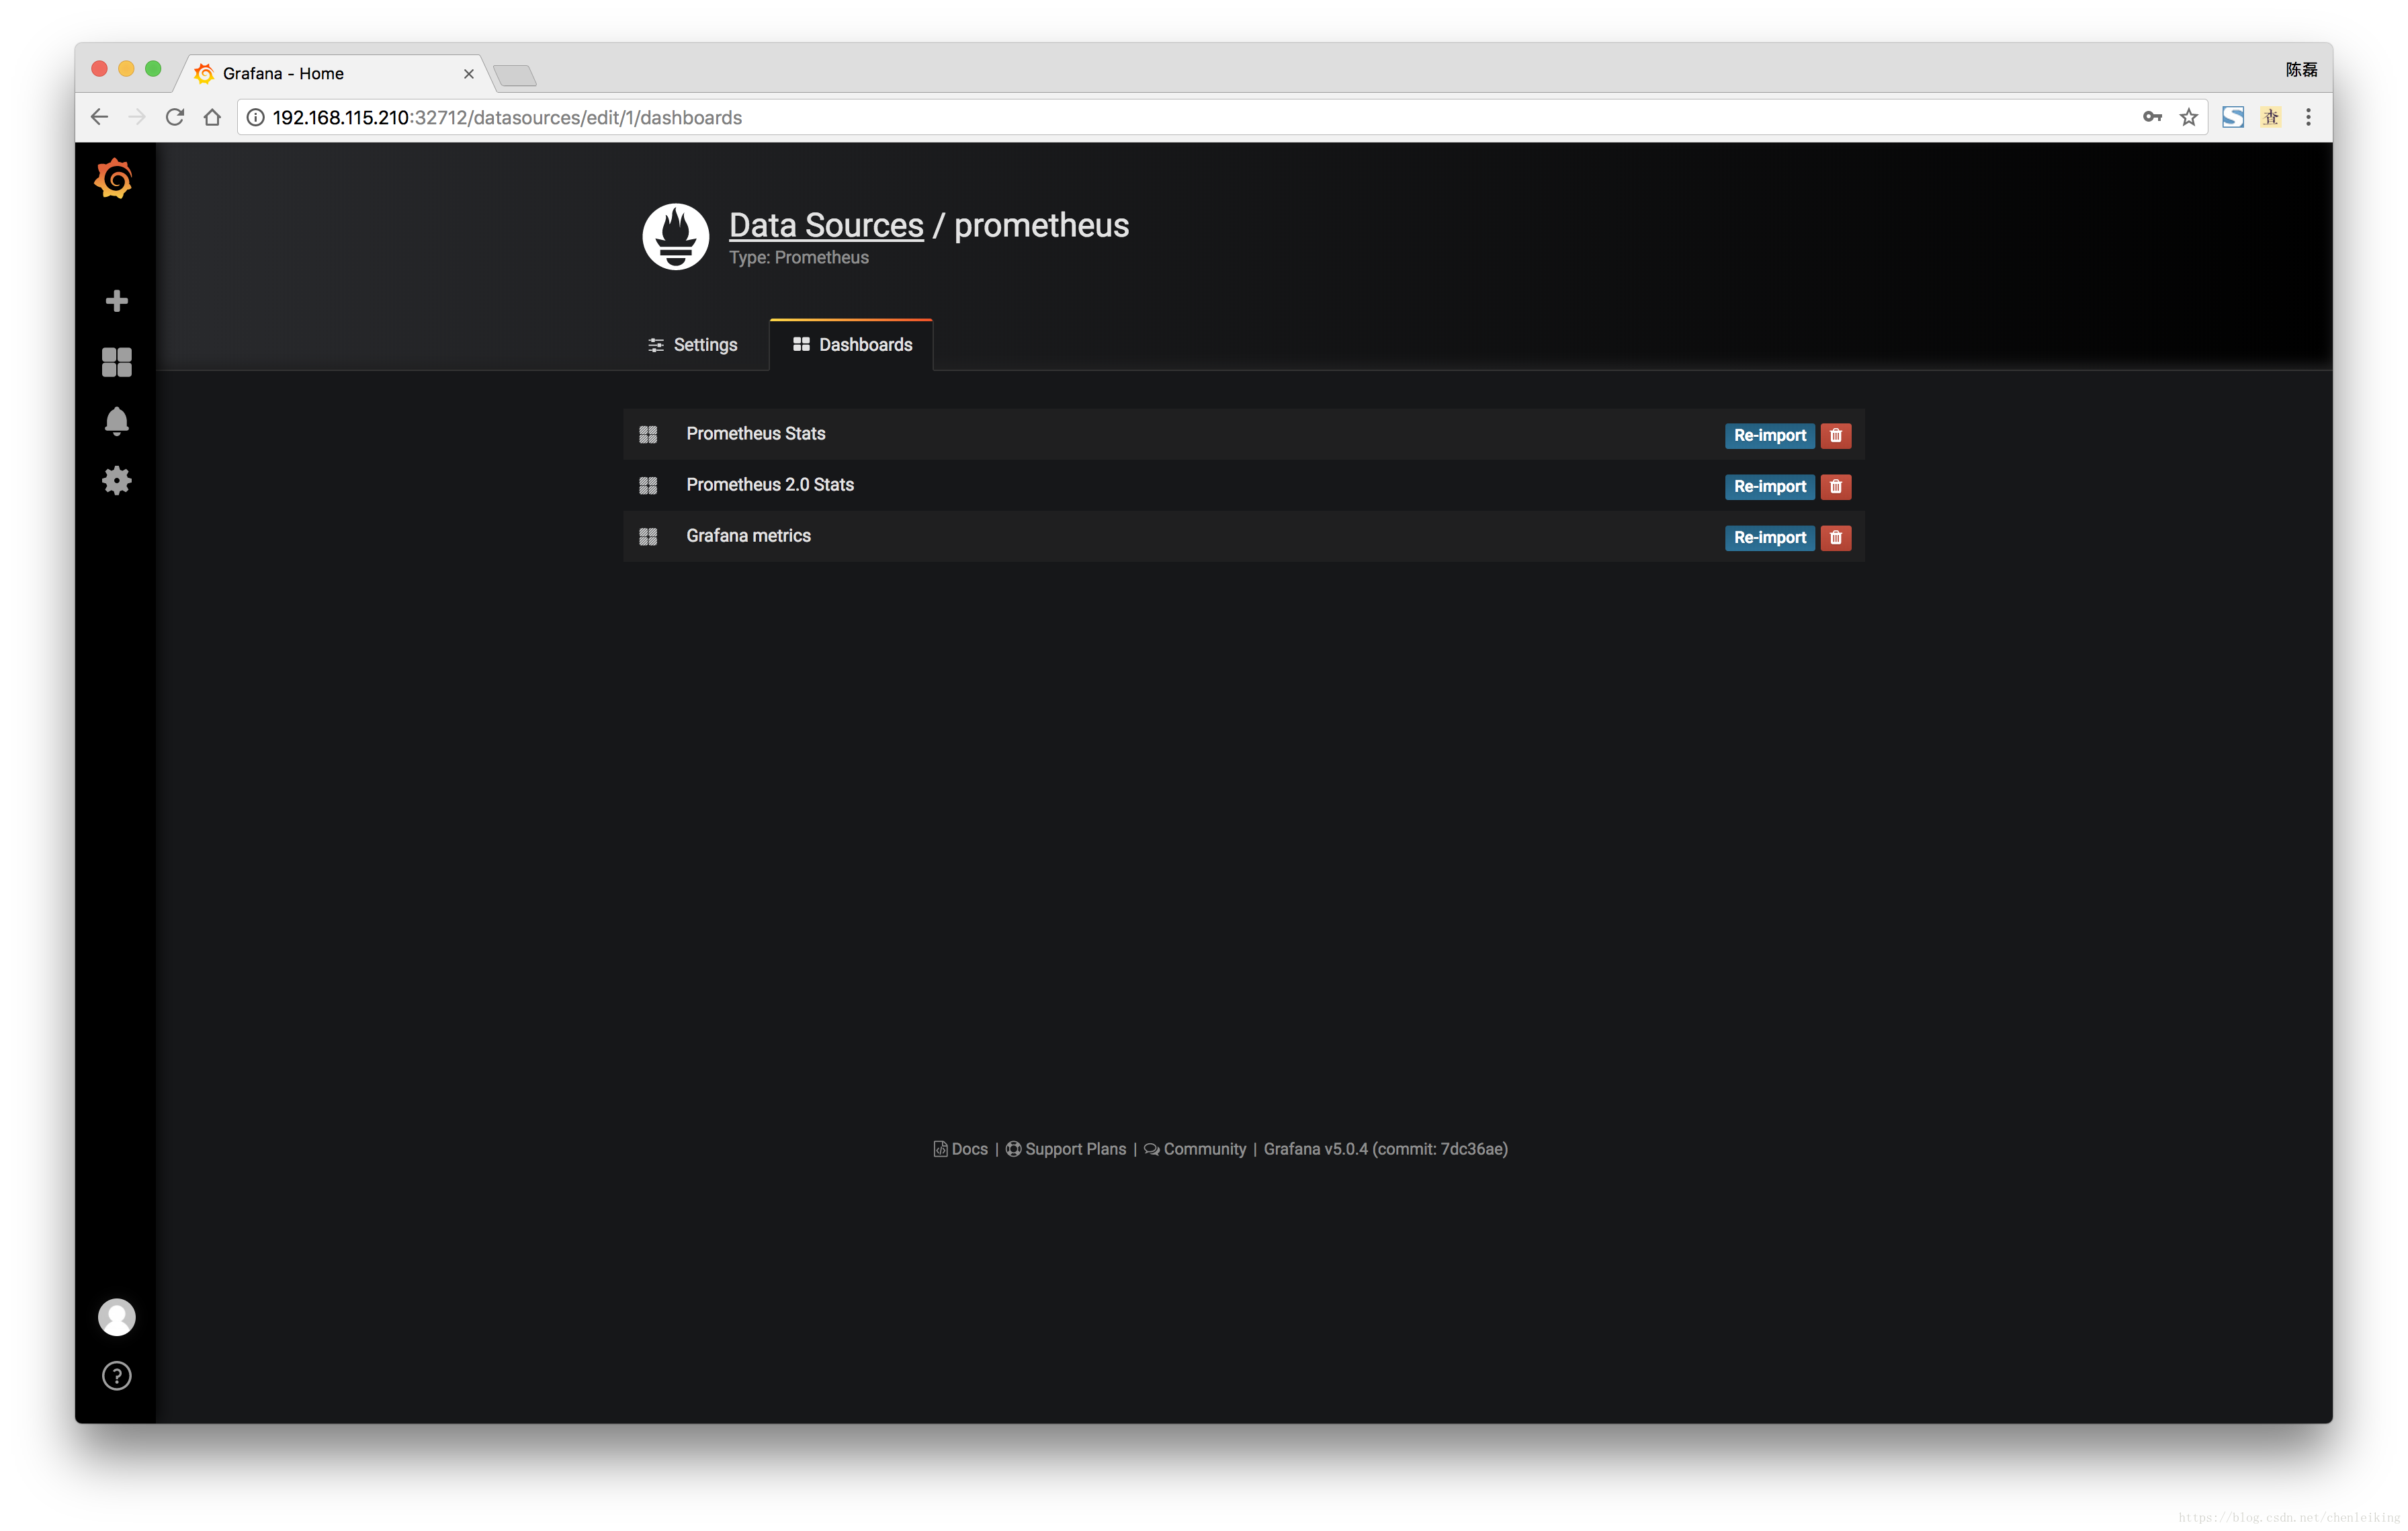
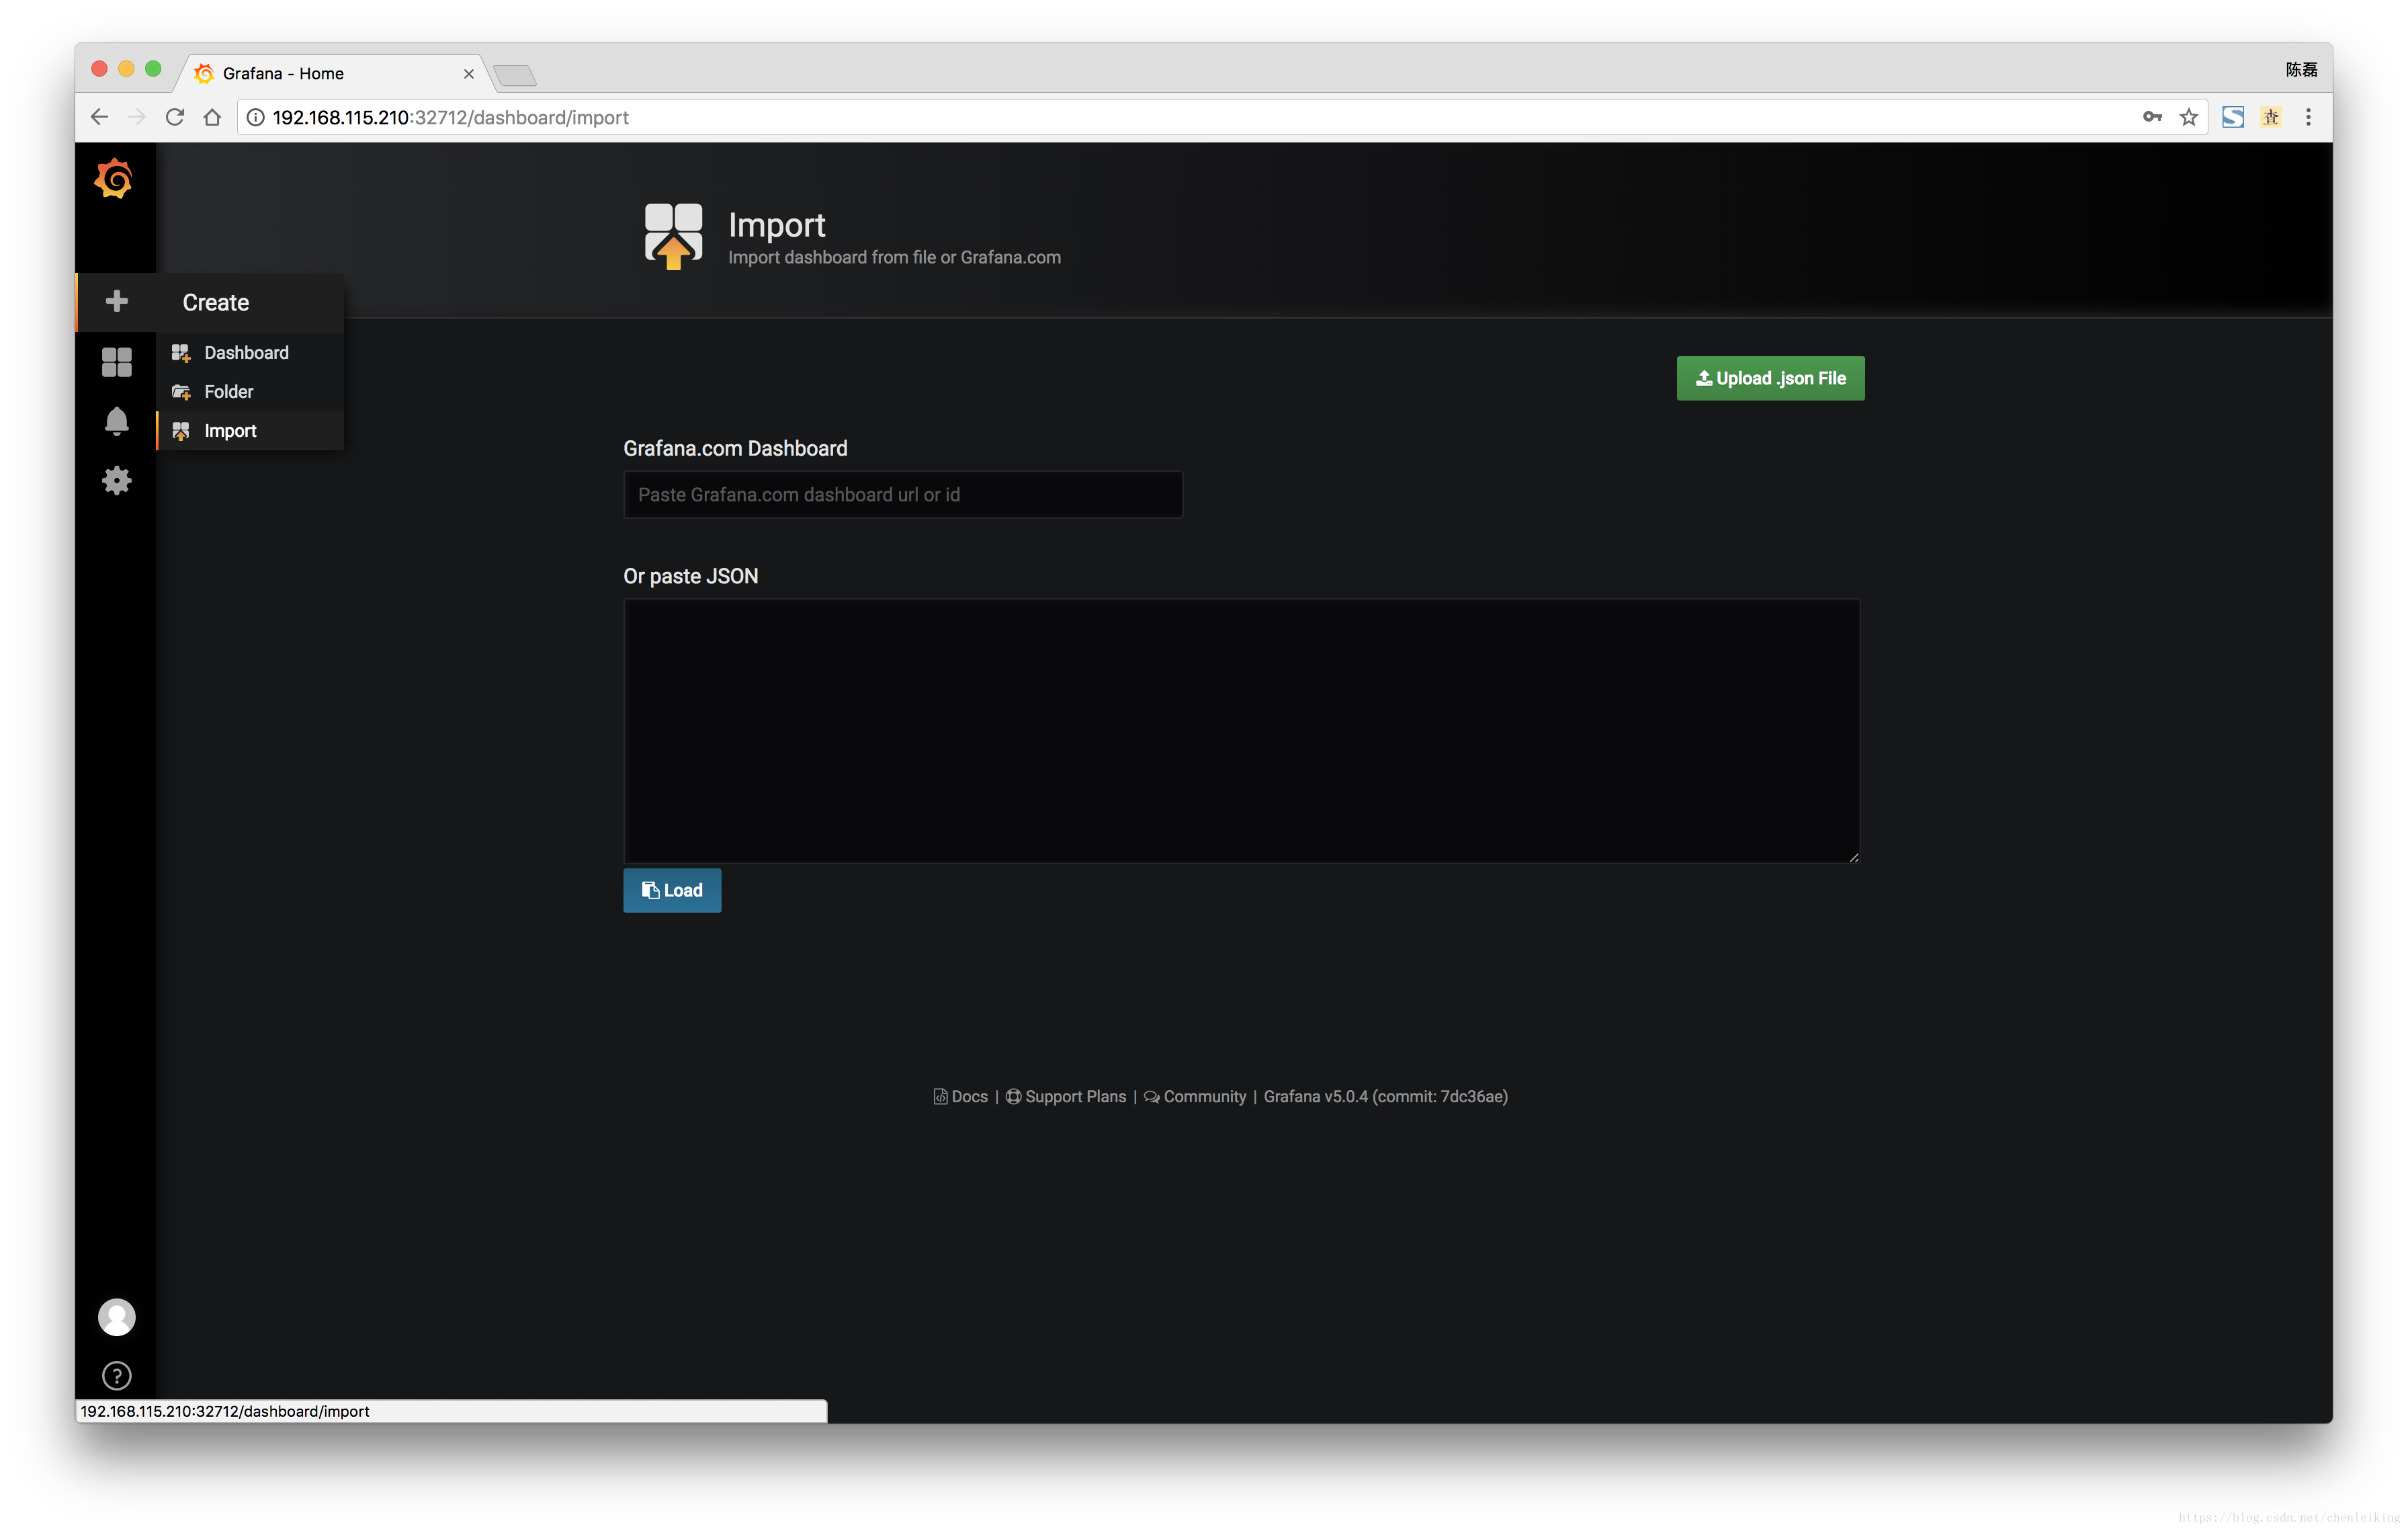
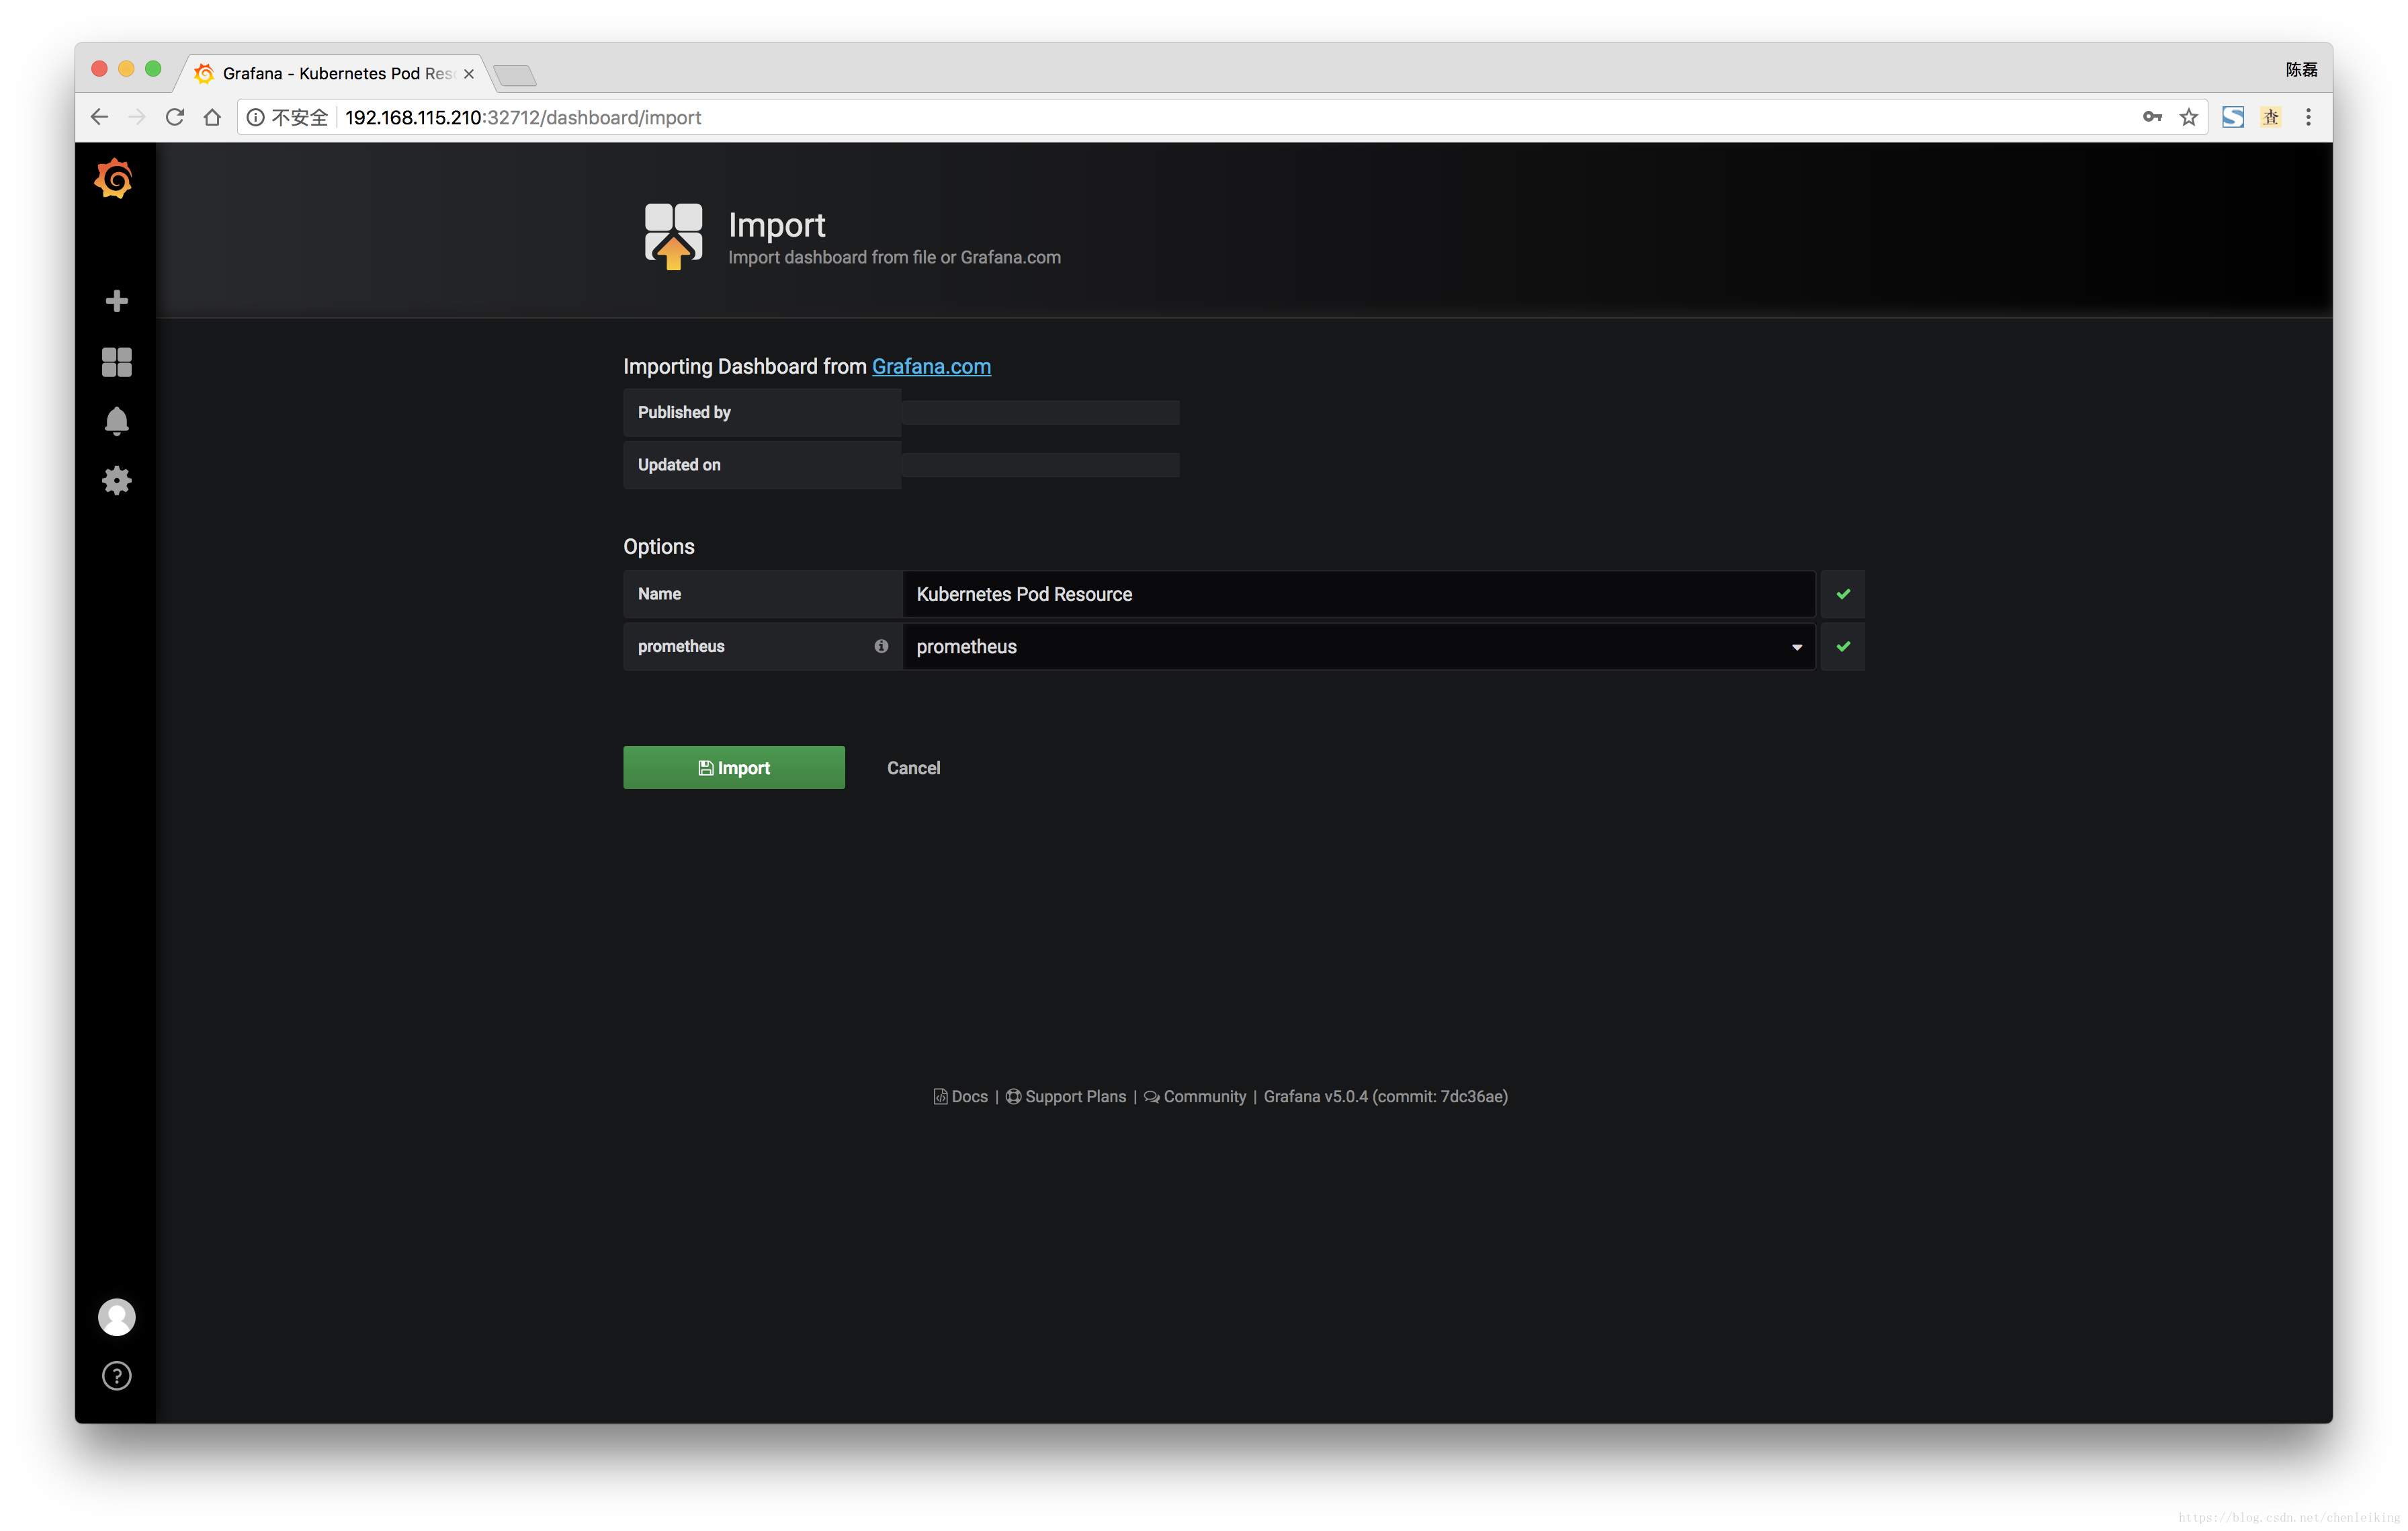
- 将prometheus配置为数据源、导入Prometheus和Grafana的Dashboard
- 导入Kubernetes的Dashboard模版,下文附下载链接
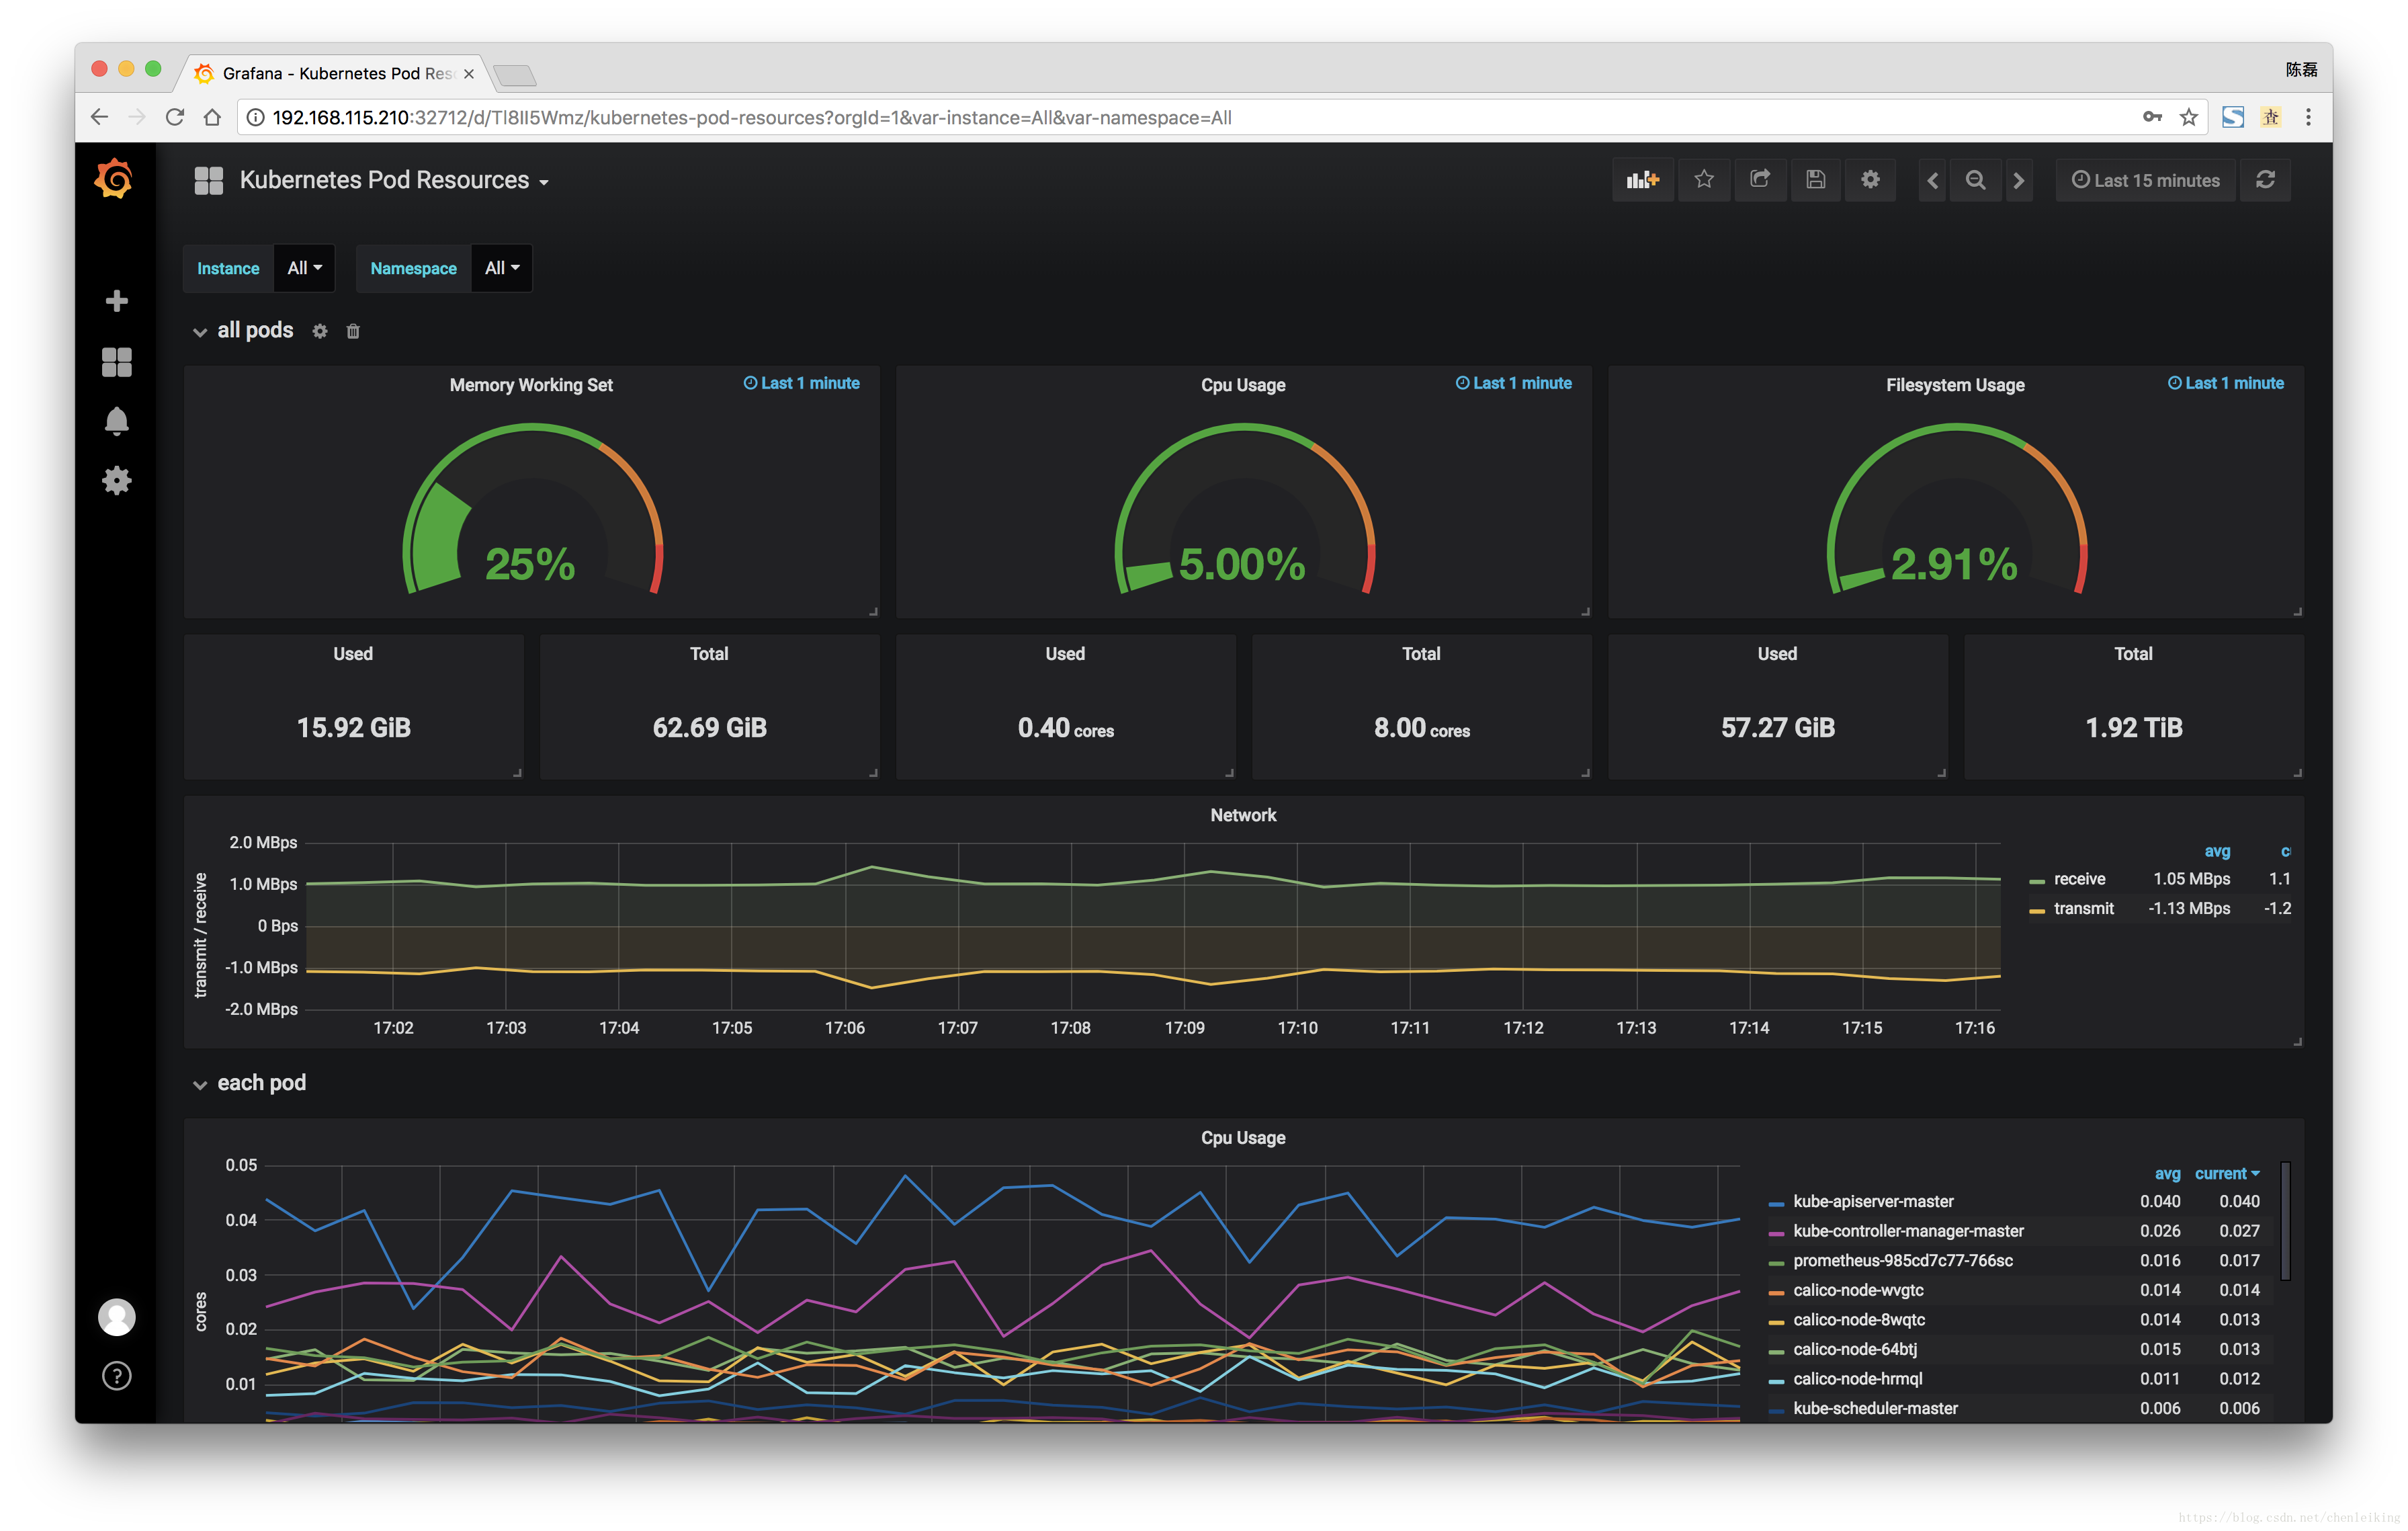
- 查看Dashboard
Dashboard中的每一个Panel可以自行编辑、保存和回滚!
如果instance下拉框显示有问题,点击右上方的设置(settings)~变量(Variables),修改$instance变量的Regex值,可以直接清空;
配置数据源、导入Dashboard、安装插件等这些操作可以配置到grafana.yml文件中,但是配置过程比较麻烦,这里先提供在界面上操作的说明,后期需要再处理。
3、参考资料
- https://prometheus.io/docs/
- http://docs.grafana.org/
- https://github.com/prometheus/prometheus/tree/release-2.2/documentation/examples
- https://github.com/giantswarm/kubernetes-prometheus
- https://github.com/zalando-incubator/kubernetes-on-aws/pull/861
- http://yunlzheng.github.io/2018/01/17/prometheus-sd-and-relabel/
4、附件下载
- Kubernetes的Grafana监控模版:https://pan.baidu.com/s/1y7HDQCPXy9LCAzA01uzIBQ