简介
之前我们学习 Prometheus 的时候就了解到 Prometheus 包含一个报警模块,就是我们的 AlertManager,Alertmanager 主要用于接收 Prometheus 发送的告警信息,它支持丰富的告警通知渠道,而且很容易做到告警信息进行去重,降噪,分组等,是一款前卫的告警通知系统。
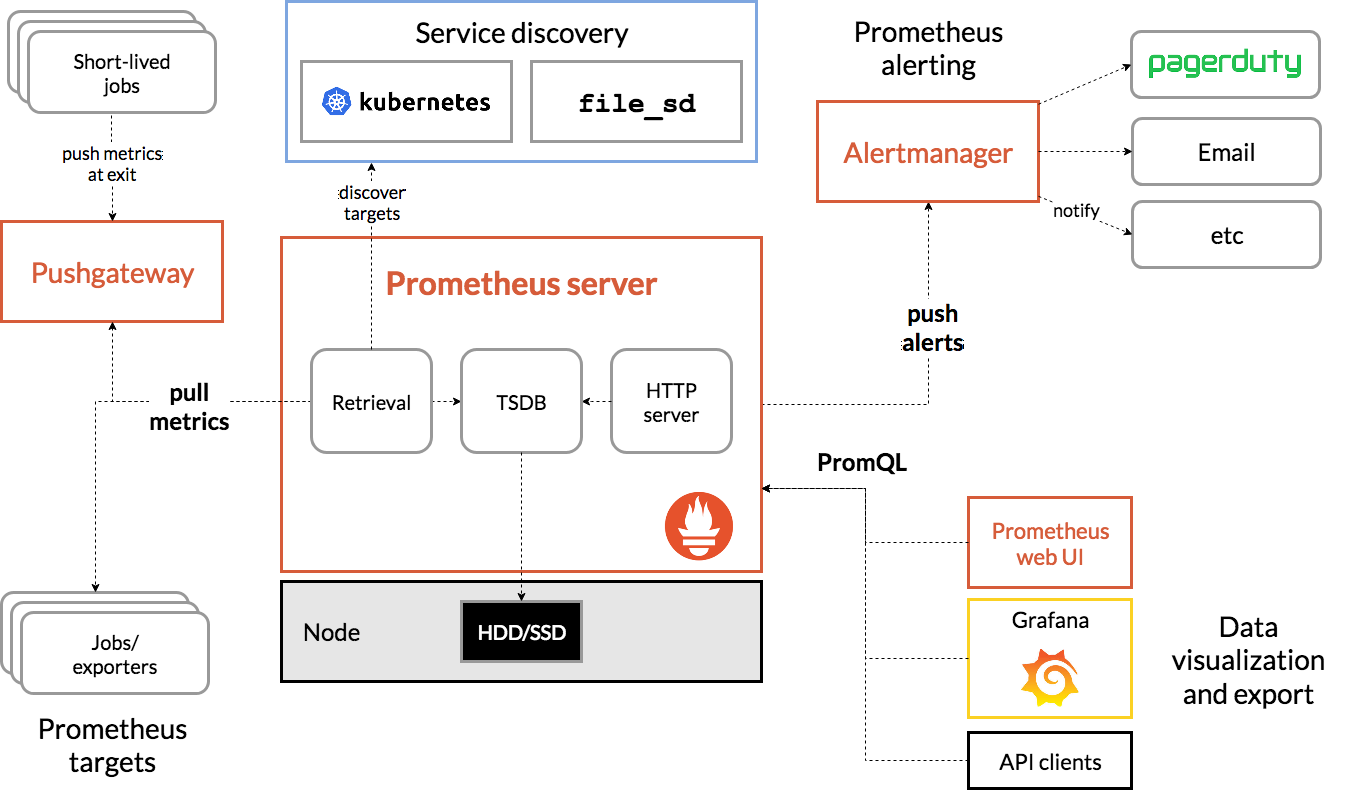
架构
接下来我们就来学习下 AlertManager 的具体使用方法。
安装
从官方文档Configuration | Prometheus中我们可以看到下载AlertManager二进制文件后,可以通过下面的命令运行:
$ ./alertmanager --config.file=simple.yml
其中-config.file参数是用来指定对应的配置文件的,由于我们这里同样要运行到 Kubernetes 集群中来,所以我们使用docker镜像的方式来安装,使用的镜像是:prom/alertmanager:v0.15.3。
首先,指定配置文件,同样的,我们这里使用一个 ConfigMap 资源对象:(alertmanager-conf.yaml)
apiVersion: v1
kind: ConfigMap
metadata:
  name: alert-config
  namespace: kube-ops
data:
  config.yml: |-
    global:
      # 在没有报警的情况下声明为已解决的时间
      resolve_timeout: 5m
      # 配置邮件发送信息
      smtp_smarthost: 'smtp.163.com:25'
      smtp_from: '[email protected]'
      smtp_auth_username: '[email protected]'
      smtp_auth_password: '<邮箱密码>'
      smtp_hello: '163.com'
      smtp_require_tls: false
    # 所有报警信息进入后的根路由,用来设置报警的分发策略
    route:
      # 这里的标签列表是接收到报警信息后的重新分组标签,例如,接收到的报警信息里面有许多具有 cluster=A 和 alertname=LatncyHigh 这样的标签的报警信息将会批量被聚合到一个分组里面
      group_by: ['alertname', 'cluster']
      # 当一个新的报警分组被创建后,需要等待至少group_wait时间来初始化通知,这种方式可以确保您能有足够的时间为同一分组来获取多个警报,然后一起触发这个报警信息。
      group_wait: 30s

      # 当第一个报警发送后,等待'group_interval'时间来发送新的一组报警信息。
      group_interval: 5m

      # 如果一个报警信息已经发送成功了,等待'repeat_interval'时间来重新发送他们
      repeat_interval: 5m

      # 默认的receiver:如果一个报警没有被一个route匹配,则发送给默认的接收器
      receiver: default

      # 上面所有的属性都由所有子路由继承,并且可以在每个子路由上进行覆盖。
      routes:
      - receiver: email
        group_wait: 10s
        match:
          team: node
    receivers:
    - name: 'default'
      email_configs:
      - to: '[email protected]'
        send_resolved: true
    - name: 'email'
      email_configs:
      - to: '[email protected]'
        send_resolved: true
这是 AlertManager 的配置文件,我们先直接创建这个 ConfigMap 资源对象:
$ kubectl create -f alertmanager-conf.yaml
configmap "alert-config" created
然后配置 AlertManager 的容器,我们可以直接在之前的 Prometheus 的 Pod 中添加这个容器,对应的 YAML 资源声明如下:
  - name: alertmanager
    image: prom/alertmanager:v0.15.3
    imagePullPolicy: IfNotPresent
    args:
    - "--config.file=/etc/alertmanager/config.yml"
    ports:
    - containerPort: 9093
      name: http
    volumeMounts:
    - mountPath: "/etc/alertmanager"
      name: alertcfg
    resources:
      requests:
        cpu: 100m
        memory: 256Mi
      limits:
        cpu: 100m
        memory: 256Mi
volumes:
- name: alertcfg
  configMap:
    name: alert-config
这里我们将上面创建的 alert-config 这个 ConfigMap 资源对象以 Volume 的形式挂载到 /etc/alertmanager 目录下去,然后在启动参数中指定了配置文件--config.file=/etc/alertmanager/config.yml,然后我们可以来更新这个 Prometheus 的 Pod:

$ kubectl apply -f prome-deploy.yaml
deployment.extensions "prometheus" configured
当然我们也可以将 AlertManager 的配置文件内容直接放入到之前的 Prometheus 的 ConfigMap 的资源对象中,也可以用一个单独的 Pod 来运行 AlertManager 这个容器,完整的资源清单文件可以参考这里:https://github.com/cnych/kubeapp/tree/master/prometheus
AlertManager 的容器启动起来后,我们还需要在 Prometheus 中配置下 AlertManager 的地址,让 Prometheus 能够访问到 AlertManager,在 Prometheus 的 ConfigMap 资源清单中添加如下配置:
alerting:
  alertmanagers:
    - static_configs:
      - targets: ["localhost:9093"]
更新这个资源对象后,稍等一小会儿,执行 reload 操作:
$ kubectl delete -f prome-cm.yaml
configmap "prometheus-config" deleted
$ kubectl create -f prome-cm.yaml
configmap "prometheus-config" created
# 隔一会儿后
$ kubectl get svc -n kube-ops
NAME         TYPE       CLUSTER-IP     EXTERNAL-IP   PORT(S)                          AGE
prometheus   NodePort   10.102.74.90   <none>        9090:30358/TCP                   3d
$ curl -X POST "http://10.102.74.90:9090/-/reload"
更新完成后,我们查看 Pod 发现有错误,查看下 alertmanager 容器的日志,发现有如下错误信息:
$ kubectl get pods -n kube-ops
NAME                          READY     STATUS             RESTARTS   AGE
prometheus-56d64bf6f7-rpz9j   1/2       CrashLoopBackOff   491        1d
$ kubectl logs -f prometheus-56d64bf6f7-rpz9j alertmanager -n kube-ops
level=info ts=2018-11-28T10:33:51.830071513Z caller=main.go:174 msg="Starting Alertmanager" version="(version=0.15.3, branch=HEAD, revision=d4a7697cc90f8bce62efe7c44b63b542578ec0a1)"
level=info ts=2018-11-28T10:33:51.830362309Z caller=main.go:175 build_context="(go=go1.11.2, user=root@4ecc17c53d26, date=20181109-15:40:48)"
level=error ts=2018-11-28T10:33:51.830464639Z caller=main.go:179 msg="Unable to create data directory" err="mkdir data/: read-only file system"这个是因为新版本dockerfile中的默认WORKDIR发生了变化,变成了/etc/alertmanager目录,默认情况下存储路径--storage.path是相对目录data/,因此,alertmanager 会在我们上面挂载的 ConfigMap 中去创建这个目录,所以会报错,我们可以通过覆盖--storage.path参数来解决这个问题,在容器启动参数中添加该参数:
- name: alertmanager
  image: prom/alertmanager:v0.15.3
  imagePullPolicy: IfNotPresent
  args:
  - "--config.file=/etc/alertmanager/config.yml"
  - "--storage.path=/alertmanager/data"
重新更新 Pod,可以发现 Prometheus 已经是 Running 状态了:
$ kubectl apply -f prome-deploy.yaml
deployment.extensions "prometheus" configured
$ kubectl get pods -n kube-ops
NAME                          READY     STATUS      RESTARTS   AGE
prometheus-646f457455-gr8x5   2/2       Running     0          3m
$ kubectl logs -f prometheus-646f457455-gr8x5 alertmanager -n kube-ops
level=info ts=2018-11-28T11:03:16.054633463Z caller=main.go:174 msg="Starting Alertmanager" version="(version=0.15.3, branch=HEAD, revision=d4a7697cc90f8bce62efe7c44b63b542578ec0a1)"
level=info ts=2018-11-28T11:03:16.054931931Z caller=main.go:175 build_context="(go=go1.11.2, user=root@4ecc17c53d26, date=20181109-15:40:48)"
level=info ts=2018-11-28T11:03:16.351058702Z caller=cluster.go:155 component=cluster msg="setting advertise address explicitly" addr=10.244.2.217 port=9094
level=info ts=2018-11-28T11:03:16.456683857Z caller=main.go:322 msg="Loading configuration file" file=/etc/alertmanager/config.yml
level=info ts=2018-11-28T11:03:16.548558156Z caller=cluster.go:570 component=cluster msg="Waiting for gossip to settle..." interval=2s
level=info ts=2018-11-28T11:03:16.556768564Z caller=main.go:398 msg=Listening address=:9093
level=info ts=2018-11-28T11:03:18.549158865Z caller=cluster.go:595 component=cluster msg="gossip not settled" polls=0 before=0 now=1 elapsed=2.000272112s
level=info ts=2018-11-28T11:03:26.558221484Z caller=cluster.go:587 component=cluster msg="gossip settled; proceeding" elapsed=10.009335611s
报警规则
现在我们只是把 AlertManager 容器运行起来了,也和 Prometheus 进行了关联,但是现在我们并不知道要做什么报警,因为没有任何地方告诉我们要报警,所以我们还需要配置一些报警规则来告诉我们对哪些数据进行报警。
警报规则允许你基于 Prometheus 表达式语言的表达式来定义报警报条件,并在触发警报时发送通知给外部的接收者。
同样在 Prometheus 的配置文件中添加如下报警规则配置:
rule_files:
  - /etc/prometheus/rules.yml
[root@master prometheus]# cat prometheus-deploy.yaml
---
apiVersion: apps/v1
kind: Deployment
metadata:
name: prometheus-server
namespace: monitor
labels:
app: prometheus
spec:
replicas: 1
selector:
matchLabels:
app: prometheus
component: server
#matchExpressions:
#- {key: app, operator: In, values: [prometheus]}
#- {key: component, operator: In, values: [server]}
template:
metadata:
labels:
app: prometheus
component: server
annotations:
prometheus.io/scrape: 'false'
spec:
serviceAccountName: monitor
containers:
- name: prometheus
image: prom/prometheus:v2.2.1
imagePullPolicy: IfNotPresent
command:
- prometheus
- --config.file=/etc/prometheus/prometheus.yml
- --storage.tsdb.path=/prometheus
- --storage.tsdb.retention=720h
- --web.enable-lifecycle
ports:
- containerPort: 9090
protocol: TCP
volumeMounts:
- mountPath: /etc/prometheus
name: prometheus-config
- name: localtime
mountPath: /etc/localtime
volumes:
- name: prometheus-config
configMap:
name: prometheus-config
- name: localtime
hostPath:
path: /usr/share/zoneinfo/Asia/Shanghai其中rule_files就是用来指定报警规则的,这里我们同样将rules.yml文件用 ConfigMap 的形式挂载到/etc/prometheus目录下面即可:
apiVersion: v1
kind: ConfigMap
metadata:
  name: prometheus-config
  namespace: kube-ops
data:
  prometheus.yml: |
    ...
    ...
    ...
    ...

  rules.yml: |
    groups:
    - name: test-rule
      rules:
      - alert: NodeMemoryUsage
        expr: (node_memory_MemTotal_bytes - (node_memory_MemFree_bytes + node_memory_Buffers_bytes + node_memory_Cached_bytes)) / node_memory_MemTotal_bytes * 100 > 20
        for: 2m
        labels:
          team: node
        annotations:
          summary: "{

   {$labels.instance}}: High Memory usage detected"
          description: "{

   {$labels.instance}}: Memory usage is above 20% (current value is: {

   { $value }}"
[root@master prometheus]# kubectl exec -it prometheus-server-5775f99578-vngfh -n monitor -c prometheus sh
kubectl exec [POD] [COMMAND] is DEPRECATED and will be removed in a future version. Use kubectl exec [POD] -- [COMMAND] instead.
/prometheus $ ls /etc/prometheus/
prometheus.yml rules.yml 上面我们定义了一个名为NodeMemoryUsage的报警规则,其中:
for语句会使 Prometheus 服务等待指定的时间, 然后执行查询表达式。labels语句允许指定额外的标签列表,把它们附加在告警上。annotations语句指定了另一组标签,它们不被当做告警实例的身份标识,它们经常用于存储一些额外的信息,用于报警信息的展示之类的。
为了方便演示,我们将的表达式判断报警临界值设置为20,重新更新 ConfigMap 资源对象,由于我们在 Prometheus 的 Pod 中已经通过 Volume 的形式将 prometheus-config 这个一个 ConfigMap 对象挂载到了/etc/prometheus目录下面,所以更新后,该目录下面也会出现rules.yml文件,所以前面配置的rule_files路径也是正常的,更新完成后,重新执行reload操作,这个时候我们去 Prometheus 的 Dashboard 中切换到alerts路径下面就可以看到有报警配置规则的数据了:
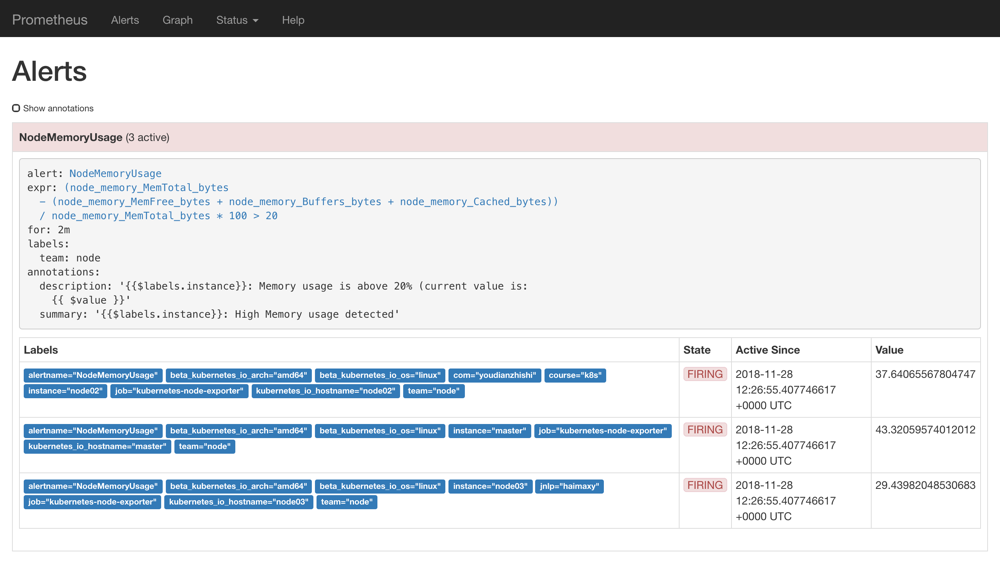
prometheus alerts
我们可以看到页面中出现了我们刚刚定义的报警规则信息,而且报警信息中还有状态显示。一个报警信息在生命周期内有下面3种状态:
- inactive: 表示当前报警信息既不是firing状态也不是pending状态
- pending: 表示在设置的阈值时间范围内被激活了
- firing: 表示超过设置的阈值时间被激活了
我们这里的状态现在是firing就表示这个报警已经被激活了,我们这里的报警信息有一个team=node这样的标签,而最上面我们配置 alertmanager 的时候就有如下的路由配置信息了:
routes:
- receiver: email
  group_wait: 10s
  match:
team: node 所以我们这里的报警信息会被email这个接收器来进行报警,我们上面配置的是邮箱,所以正常来说这个时候我们会收到一封如下的报警邮件:
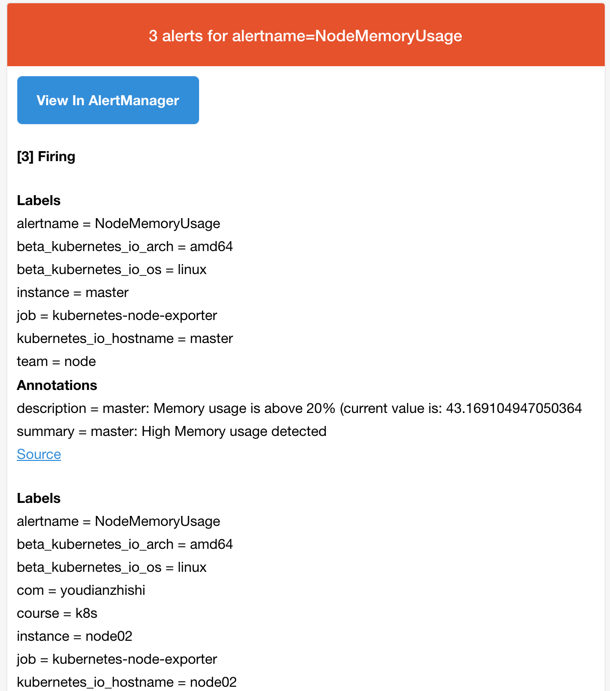
prometheus email receiver